Ethereum ETH USDT is currently trapped within narrow consolidation ranges on both timeframes. A firm break in either direction is needed to provide clarity on the next potential move. Traders should wait for signals to emerge before entering fresh positions.
For a more in-depth technical analysis across different timeframes, please click the link to view the identified levels of support and resistance, trends, and reversal patterns on the weekly, and daily charts.
4 Hour Timeframe
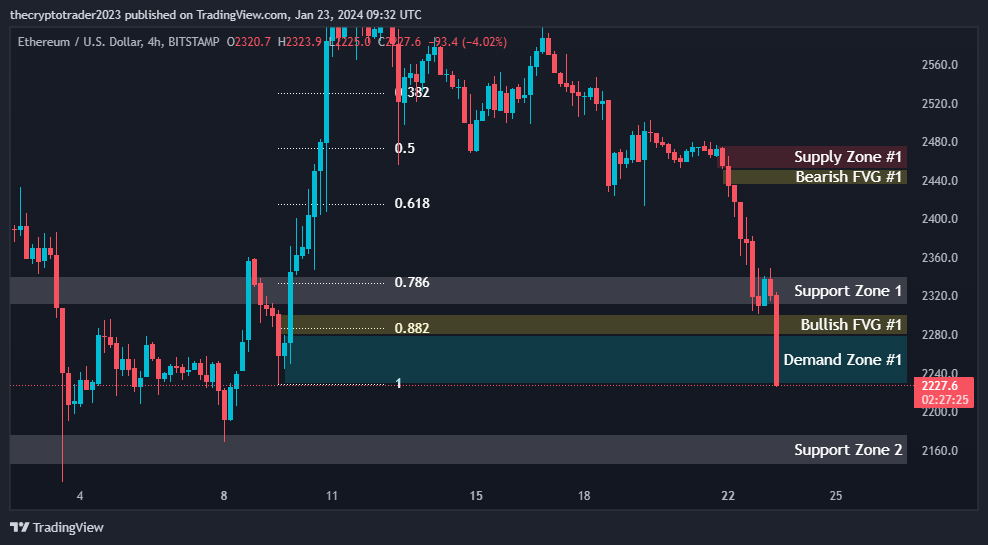
On the 4 hour chart, we can see that Ethereum ETH USDT is currently trading between the Support Level #1 of 2340.7-2310.4 and Support Level #2 of 2176.3-2145. There is a supply zone formed between 2452-2477 which could act as resistance. The major demand zone is between 2228.7-2279.1 which aligns with the Fibonacci 0.618 retracement level of 2414.9.
The current price is hovering just above Support Level #1, so this area will be key to hold. A break below 2310.4 could see further downward movement towards Support Level #2 and the 0.786 Fibonacci level of 2332.9. Alternatively, a push above 2340.7 may see a retest of resistance around the supply zone and 0.50 Fibonacci level of 2472.6.
Looking at the fair value gaps, we can see a bearish FVG formed between 2452-2435.3 which reinforces the supply zone resistance. Meanwhile, a bullish FVG has emerged between 2301.6-2279.1 adding strength to the demand zone below.
Support and Resistance Levels
| S / R Type | High | Low |
| Support Level #1 | 2340.7 | 2310.4 |
| Support Level #2 | 2176.3 | 2145.0 |
Fibonacci Retracement Levels
| 0.382 | 2530.3 |
| 0.50 | 2472.6 |
| 0.618 | 2414.9 |
| 0.786 | 2332.9 |
| 0.882 | 2286.7 |
Supply Zone
| Zone Number | High | Low |
| 2477.0 | 2452.0 |
Demand Zone
| Zone Number | High | Low |
| Demand Zone #1 | 2279.1 | 2228.7 |
Fair Value Gaps / Imbalances
| Gap Number | High | Low |
| Bearish FVG #1 | 2452.0 | 2435.3 |
| Bullish FVG #1 | 2301.6 | 2279.1 |
With the price holding above Support Level #1 for now, the bias remains neutral to bullish in the short term. A break above 2340.7 would shift the outlook to bullish with targets at the supply zone high of 2452 and potential upper Fibonacci levels. Alternatively, a drop below 2310.4 support could see a retest of the major demand zone and lower support levels in the near future.
1 Hour Timeframe
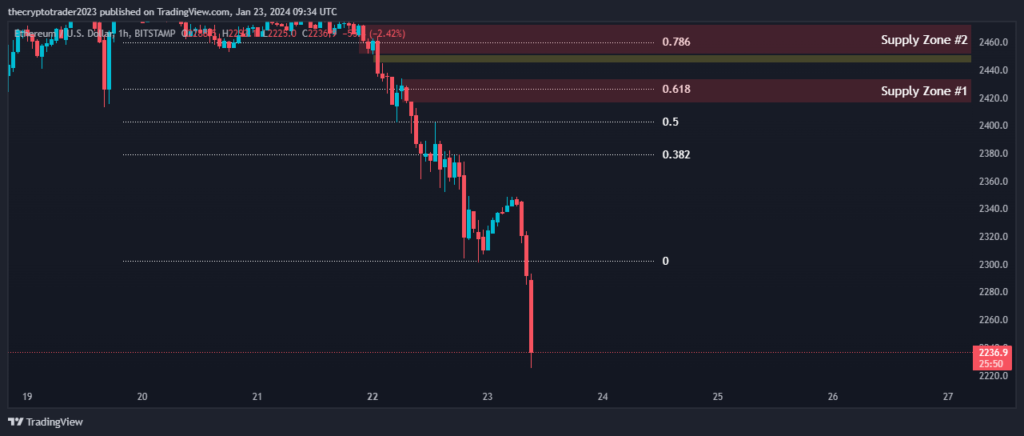
Zooming into the 1 hour chart, we can see Ethereum ETH USDT is consolidating between the 0.382 and 0.786 Fibonacci levels which is a neutral range for now. There is a newly formed supply zone between 2433.6-2416.2 which may act as initial resistance. Above this, Supply Zone #2 between 2472.9-2451 aligns with the 0.50 Fibonacci level and establishes a tougher resistance area.
The closest supports are now the 0.382 and 0.618 Fibonacci levels falling between 2378.9-2426.3. A break below these levels opens up the path lower towards the demand zone identified on the 4 hour chart.
A bearish fair value gap has developed between 2451-2444.7 which reinforces Supply Zone #2 as stiff resistance for any upside breakout attempts in the short term.
Fibonacci Retracement Levels
| 0.382 | 2378.9 |
| 0.50 | 2402.6 |
| 0.618 | 2426.3 |
| 0.786 | 2459.9 |
| 0.882 | 2479.0 |
Supply Zone
| Zone Number | High | Low |
| Supply Zone #1 | 2433.6 | 2416.2 |
| Supply Zone #2 | 2472.9 | 2451.0 |
Fair Value Gaps / Imbalances
| Gap Number | High | Low |
| Bearish FVG #1 | 2451.0 | 2444.7 |
As long as Ethereum remains trading within the 1 hour Bollinger Bands and above the mid-range 0.50 Fibonacci level of 2402.6, the short term outlook is neutral to mildly bullish.
However, a move above Supply Zone #1 at 2433.6 would be needed to shift the bias bullish with targets at Supply Zone #2 and the upper Fibonacci levels. To the downside, a break below 2378.9 support with increased volume could introduce some bearish pressure back towards the major demand zone.