Currently, FIL USDT is trading in a horizontal range between the support zone of $4.374-$4.169 and resistance zone of $5.422-$5.217 on the daily timeframe. The price is currently finding support just above the support zone at $5.124.
While the daily timeframe presents a neutral outlook, the 1-hour chart denotes potential short term bullishness for FIL USDT with support at hand. A bounce from current levels back above $5.077 resistance would strengthen the case for upside towards the top of the daily range near $5.42. Downside seems limited unless the $5.018 support cracks.
Let us examine the key technical aspects of FIL USDT in detail:
Daily Timeframe Analysis
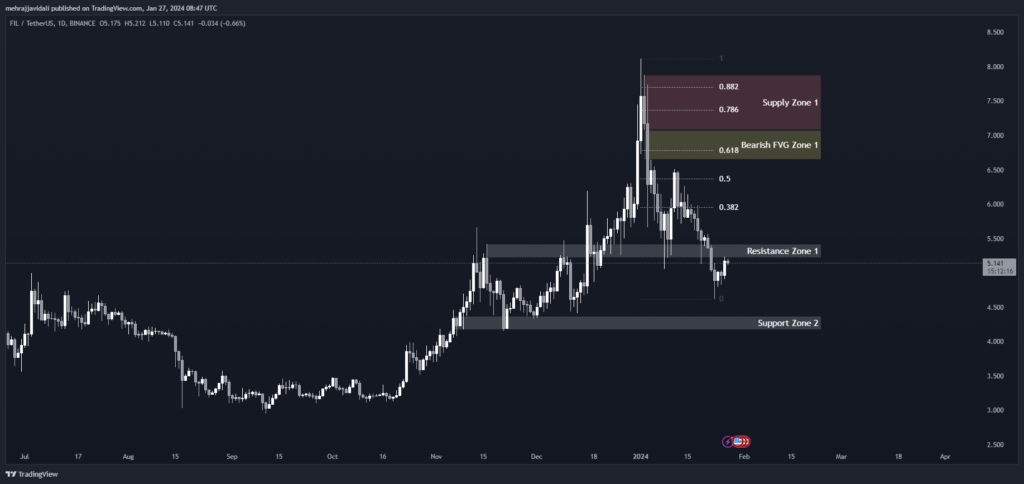
The daily chart shows that FIL USDT, We can see higher highs and higher lows being formed, indicating an overall bullish sentiment in the long term.
The 0.382, 0.50 and 0.618 Fibonacci retracement levels provide resistance in the $5.95-6.78 range. A break above the 0.618 level would signal continuation of the uptrend.
There is a supply zone between $7.884-7.079 which could catalyze a further correction if reached.
Additionally, there is a bearish fair value gap (FVG) between $7.079-6.649. FVGs act as magnets and the price often revisits the low of such gaps to fill them, providing potential shorts.
The daily timeframe presents a neutral to bullish picture with consolidation in the $4.37-5.42 range. A break above $6.78 is needed to reaffirm the long term uptrend. Downside risks exist from the supply zone and bearish FVG.
Support and Resistance Levels
| S / R Type | High | Low |
| Support Zone 1 | 4.374 | 4.169 |
| Resistance Zone 1 | 5.422 | 5.217 |
Fibonacci Retracement Levels
| 0.382 | 5.954 |
| 0.50 | 6.371 |
| 0.618 | 6.778 |
| 0.786 | 7.365 |
| 0.882 | 7.704 |
Supply Zone
| Zone Number | High | Low |
| Supply Zone 1 | 7.884 | 7.079 |
Fair Value Gaps / Imbalances
| Gap Number | High | Low |
| Bearish FVG Zone 1 | 7.079 | 6.649 |
1 Hour Timeframe Analysis
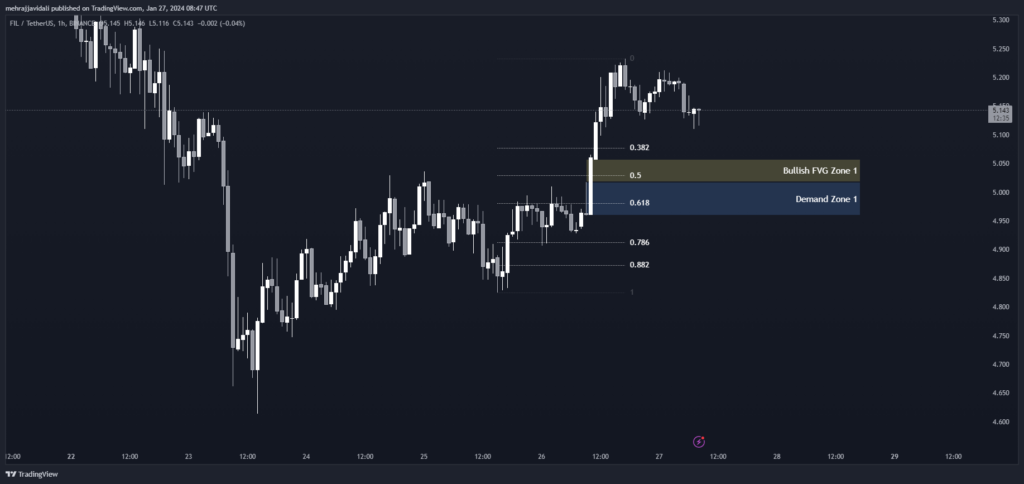
Zooming into the 1-hour chart, we can see FIL USDT is currently hovering right above a demand zone between $5.018-4.959. This zone, if broken, could lead to further downside towards the lower boundary of the daily support zone.
There is bullish pressure from the 0.382, 0.5 and 0.618 Fibonacci retracement levels in the $5.077-4.981 range. A bounce from current levels back above $5.077 would signal short term buyers are active.
Furthermore, we can see a bullish fair value gap from $5.058-5.018. As mentioned earlier, these gaps act as magnets and the price will look to revisit the high of such gaps, providing potential long opportunities.
This short term bullish structure signifies FIL USDT is currently finding support and could see some upside motion back within the range in coming sessions. Immediate support is at $5.018 demand zone.
Fibonacci Retracement Levels
| 0.382 | 5.077 |
| 0.50 | 5.029 |
| 0.618 | 4.981 |
| 0.786 | 4.912 |
| 0.882 | 4.873 |
Demand Zone
| Zone Number | High | Low |
| Demand Zone 1 | 5.018 | 4.959 |
Fair Value Gaps / Imbalances
| Gap Number | High | Low |
| Bullish FVG Zone 1 | 5.058 | 5.018 |