On the 4 hour timeframe of FIL USDT, we see potential resistance in the 5.189-5.050 range based on Fibonacci retracements. The demand zone from 4.992-4.928 and bullish FVG zone from 5.098-4.992 may provide support on declines.
Examining the 1 hour chart, the supply zone from 5.340-5.305 may halt upward moves in the near term. Fibonacci retracements on this timeframe also provide potential resistance levels.
This technical analysis has used tools like Fibonacci, demand zones, and supply/resistance levels to identify key price points on FIL USDT. Monitoring how price reacts to these levels will provide traders with insight on potential reversal opportunities.
4 Hour Timeframe
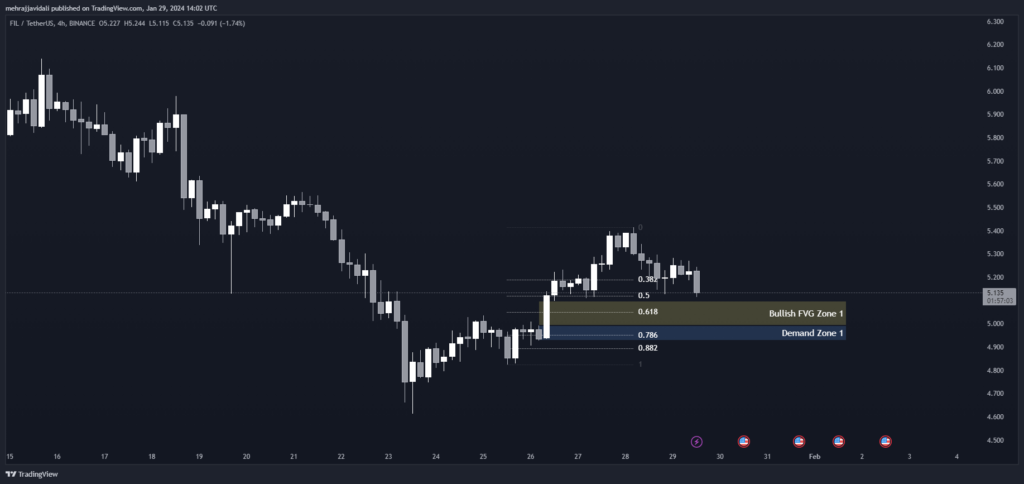
We can analyze the 4 hour timeframe to gain insight into the medium-term trend and identify key support and resistance levels. As seen in the table above, using Fibonacci retracement levels on the latest swing high and low provides targets for potential reversal zones.
Fibonacci Retracement Levels
The 0.382, 0.50, and 0.618 retracement levels fall between 5.189 and 5.050, indicating this zone may offer resistance. Below that, the 0.786 and 0.882 levels at 4.950 and 4.894 respectively may also serve as resistance if prices pull back.
| 0.382 | 5.189 |
| 0.50 | 5.120 |
| 0.618 | 5.050 |
| 0.786 | 4.950 |
| 0.882 | 4.894 |
Demand Zone
Examining demand zones, the zone between 4.992 and 4.928 is noteworthy. Demand zones are areas of previous support that may now act as support again, so this zone could halt a downward move.
| Zone Number | High | Low |
| Demand Zone 1 | 4.992 | 4.928 |
Fair Value Gaps / Imbalances
Fair value gaps (FVGs) refer to areas with an imbalance of buy or sell orders. As seen, there is a bullish FVG zone between 5.098 to 4.992, showing a lack of sell orders and potential upward pressure in this region.
| Gap Number | High | Low |
| Bullish FVG Zone 1 | 5.098 | 4.992 |
Overall on the 4 hour chart, we see potential resistance in the 5.189-5.050 zone based on Fibonacci retracements. Support may be found between 4.992-4.928 at a demand zone and again between 5.098-4.992 in the bullish FVG zone if prices decline.
1 Hour Timeframe
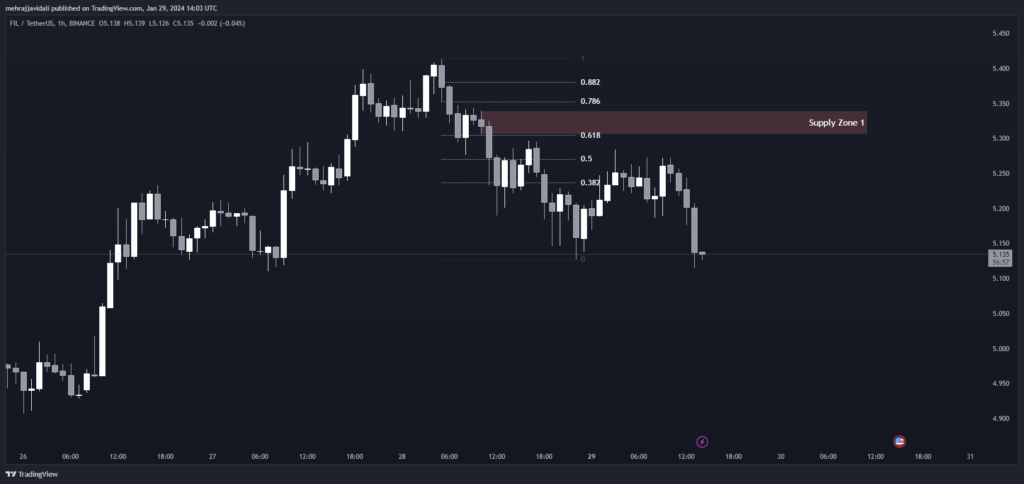
Zooming into the 1 hour chart allows us to identify shorter term levels. The supply zone between 5.340-5.305 may act as resistance on an upward move in the short term as it is an area of previous resistance.
Applying Fibonacci retracements to the latest 1 hour swing high and low, the 0.382, 0.50 and 0.618 levels at 5.237, 5.271, and 5.305 respectively form potential resistance. Below that, support could be found around the 0.786 level of 5.271 and the 0.882 level of 5.380 if prices pull back in the near future.
Support and Resistance Levels
| S / R Type | High | Low |
| Supply Zone 1 | 5.340 | 5.305 |
Fibonacci Retracement Levels
| 0.382 | 5.237 |
| 0.50 | 5.271 |
| 0.618 | 5.305 |
| 0.786 | 5.271 |
| 0.882 | 5.380 |