Filecoin (FILUSDT) is currently consolidating within key support and resistance zones after an upside breakout on lower timeframes.
Weekly and daily charts reflect a positive technical picture while the short term momentum remains neutral to positive. The prevailing trend is likely to remain bullish as long as the crucial support levels on daily and lower timeframes hold.
Meanwhile, the overhead resistances on daily and 4-hour charts need to be crossed on the upside for a sustained rally. Traders can look for buying opportunities on dips towards support levels and stay hedged by maintaining appropriate stop-losses.
Upside breakouts on the daily and 4-hour timeframes could fuel the next leg of rally.
Weekly Timeframe
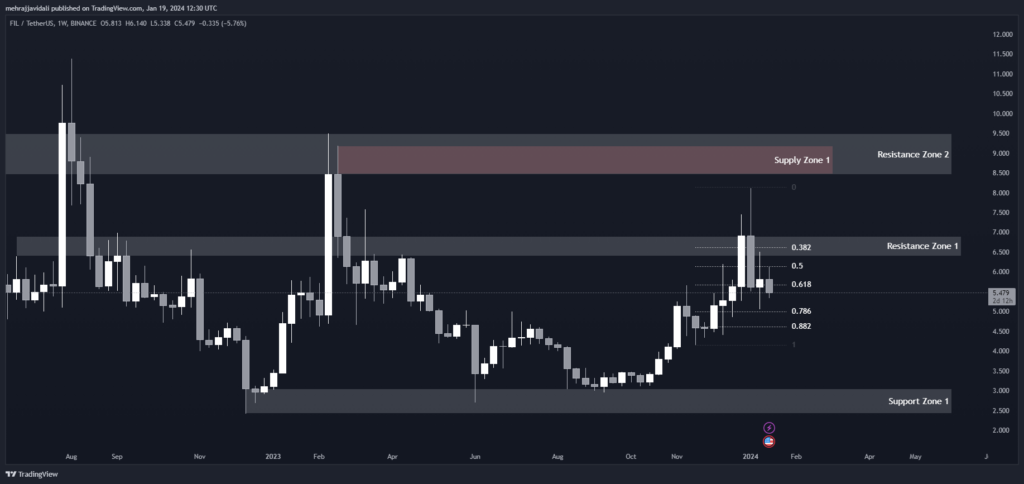
On the weekly chart, FILUSDT is currently trading between the 0.618 Fibonacci retracement level of 5.674 and supply zone 1 of 8.467-8.298. The price is respecting support zone 1 of 3.046-2.419 as a long-term support area.
As long as the price remains above this zone, the overall trend will remain bullish. However, a weekly close below this zone would signal a trend reversal to bearish. On the upside, resistance zones 1 and 2 of 6.904-6.399 and 9.500-8.450 will act as overhead resistances.
A weekly breakout above resistance zone 2 could see the price rally higher towards the all-time high.
Support and Resistance Levels
| S / R Type | High | Low |
| Resistance Zone 1 | 6.904 | 6.399 |
| Resistance Zone 2 | 9.500 | 8.450 |
| Support Zone 1 | 3.046 | 2.419 |
Fibonacci Retracement Levels
| 0.382 | 6.613 |
| 0.50 | 6.138 |
| 0.618 | 5.674 |
| 0.786 | 4.998 |
| 0.882 | 4.612 |
Supply Zone
| Zone Number | High | Low |
| Supply Zone 1 | 9.183 | 8.467 |
Daily Timeframe
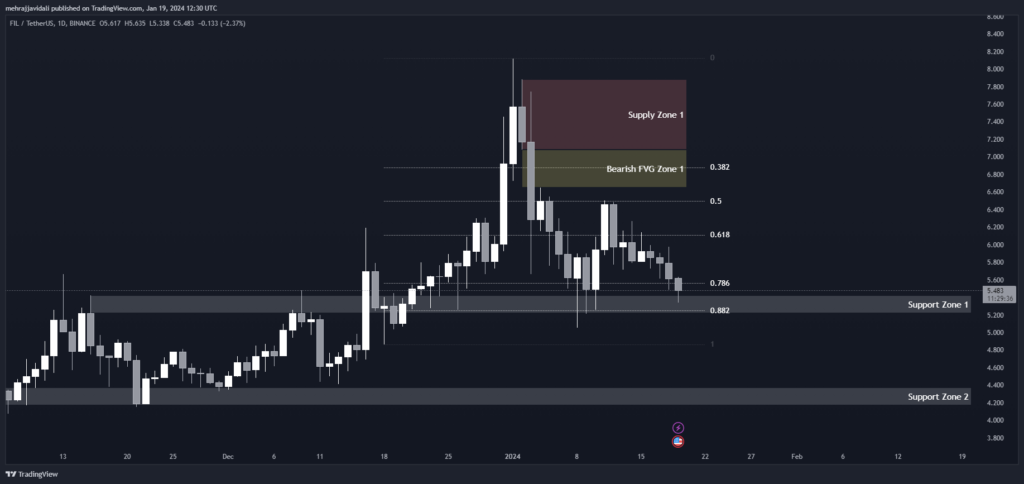
Zooming into the daily chart, we can see the price is currently consolidating between support zone 1 of 5.422-5.217 and supply zone 1 of 7.884-7.079. The 0.618 and 0.786 Fibonacci retracement levels of 6.108 and 5.561 respectively will provide support on further declines.
The bearish fair value gap (FVG) zone 1 of 7.079-6.649 acts as an interim resistance and needs to be crossed for an upside extension. Overall, as long as the daily closing remains above support zone 1, the short to medium term outlook will remain positive.
However, a daily close below this zone would weaken the bullish case and can possibly lead to a deeper pullback.
Support and Resistance Levels
| S / R Type | High | Low |
| Support Zone 1 | 5.422 | 5.217 |
| Support Zone 2 | 4.374 | 4.169 |
Fibonacci Retracement Levels
| 0.382 | 6.880 |
| 0.50 | 6.494 |
| 0.618 | 6.108 |
| 0.786 | 5.561 |
| 0.882 | 5.250 |
Supply Zone
| Zone Number | High | Low |
| Supply Zone 1 | 7.884 | 7.079 |
Fair Value Gaps / Imbalances
| Gap Number | High | Low |
| Bearish FVG Zone 1 | 7.079 | 6.649 |
4 Hour Timeframe
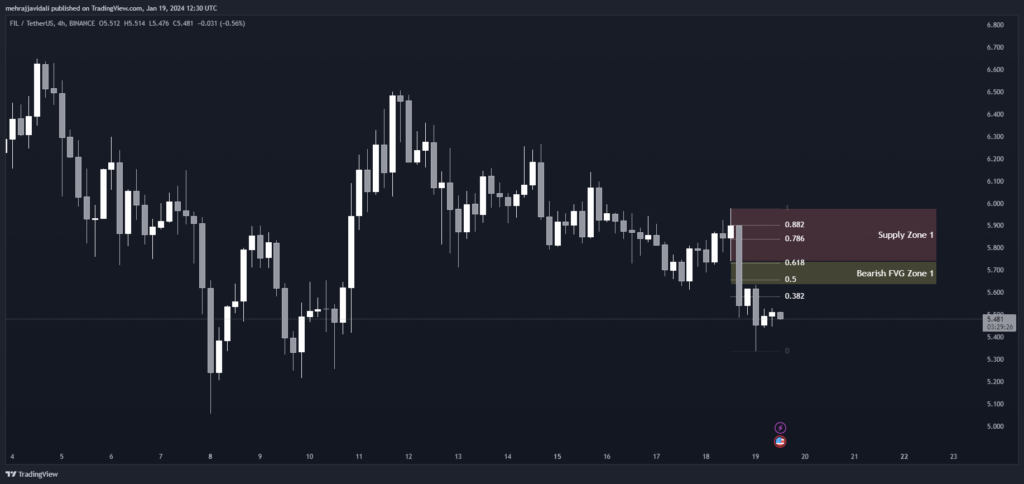
On the 4-hour scale, the price recently bounced up from the 0.618 Fibonacci retracement level of 5.733 and is facing resistance at supply zone 1 of 5.978-5.740.
A break above this zone can push the price towards the next resistances at 6.108 and 6.304 levels. Alternatively, a failure to sustain gains above 5.740 may lead to a retest of the support levels.
The bearish fair value gap (FVG) zone 1 of 5.740-5.635 adds to the support. The short term momentum remains neutral to positive as long as the price holds above the stated support zone. A break below this level would signal further weakness.
Fibonacci Retracement Levels
| 0.382 | 5.583 |
| 0.50 | 5.657 |
| 0.618 | 5.733 |
| 0.786 | 5.840 |
| 0.882 | 5.902 |
Supply Zone
| Zone Number | High | Low |
| Supply Zone 1 | 5.978 | 5.740 |
Fair Value Gaps / Imbalances
| Gap Number | High | Low |
| Bearish FVG Zone 1 | 5.740 | 5.635 |
1 Hour Timeframe
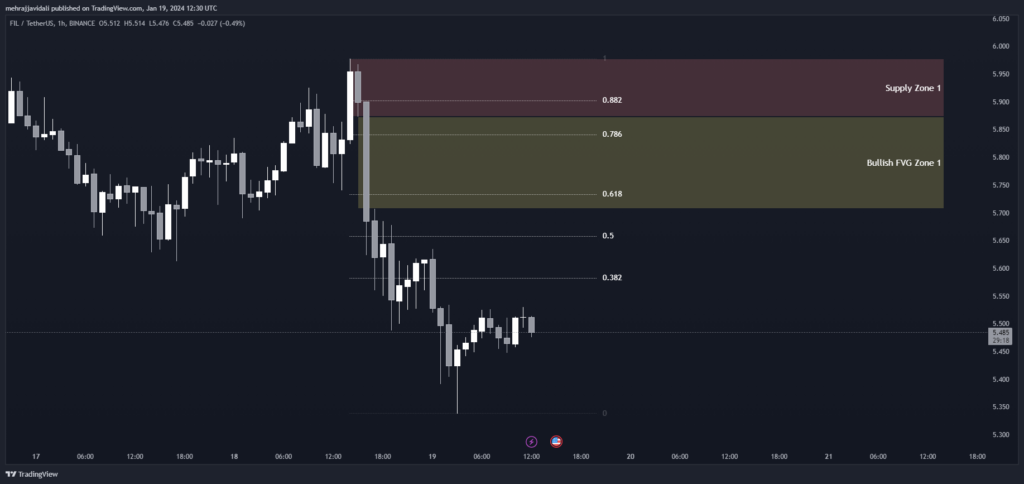
Looking at a lower 1-hour time frame, we can see the price is currently consolidating within the bullish fair value gap (FVG) zone 1 of 5.873-5.707. The 0.382, 0.50, 0.618 and 0.786 Fibonacci retracement levels lie in a narrow range of 5.583 to 5.902 which will provide support on further downsides in the near term.
A break above the FVG resistance can push the price towards supply zone 1 of 5.978-5.873. The positive short term momentum will likely continue as long as the price respects the FVG support zone. On the flip side, a break below this zone would weaken the short term bullish case.
Fibonacci Retracement Levels
| 0.382 | 5.583 |
| 0.50 | 5.659 |
| 0.618 | 5.733 |
| 0.786 | 5.840 |
| 0.882 | 5.902 |
Supply Zone
| Zone Number | High | Low |
| Supply Zone 1 | 5.978 | 5.873 |
Fair Value Gaps / Imbalances
| Gap Number | High | Low |
| Bullish FVG Zone 1 | 5.873 | 5.707 |