The weekly and daily timeframes of ICP USDT exhibit bullish technical structures while shorter timeframes show weakness. A weekly or daily close above key resistance levels would signal a potential trend change to bullish on larger frames. For now, the short term bias is bearish.
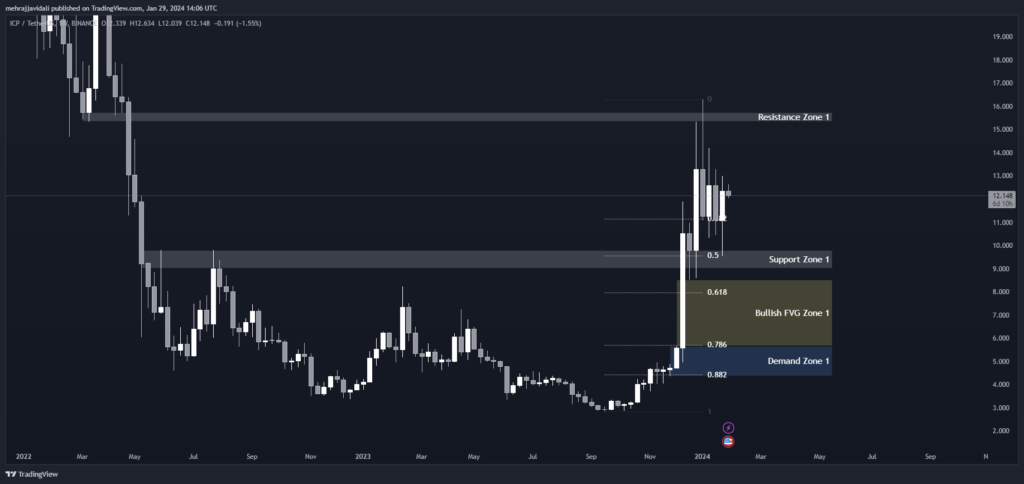
On the weekly timeframe, ICP USDT is currently trading within Resistance Zone 1 between $15.750-15.340. It has rebounded from Support Zone 1 between $9.800-8.990.
The 0.50 Fibonacci retracement level sits at $9.600, just above Demand Zone 1 between $5.664-4.355. There is an open Bullish Fair Value Gap between $8.530-5.664 that could attract buying pressure.
Overall, the weekly chart shows signs of a potential trend reversal with resistance and demand levels forming.
Support and Resistance Levels
S / R Type
High
Low
Support Zone 1
9.800
8.990
Resistance Zone 1
15.750
15.340
Fibonacci Retracement Levels
0.382
11.159
0.50
9.600
0.618
7.982
0.786
5.718
0.882
4.423
Demand Zone
Zone Number
High
Low
Demand Zone 1
5.664
4.355
Fair Value Gaps / Imbalances
Gap Number
High
Low
Bullish FVG Zone 1
8.530
5.664
Daily Timeframe
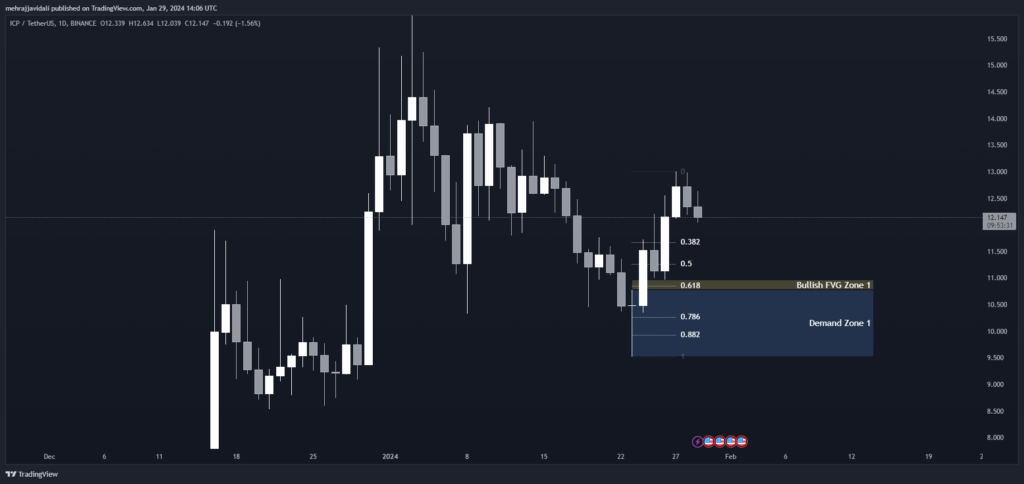
On the daily chart, ICP USDT is testing the 0.618 Fibonacci retracement level of $10.850 after rebounding from Demand Zone 1 between $10.784-9.523. It is currently trading within Bullish Fair Value Gap Zone 1 between $10.964-10.784.
A close above $11.259 (0.50 Fibonacci) would confirm the short term trend is turning bullish. Supporting levels need to hold for the uptrend to continue. The daily technicals are neutral to bullish.
Fibonacci Retracement Levels
0.382
11.676
0.50
11.259
0.618
10.850
0.786
10.266
0.882
9.932
Demand Zone
Zone Number
High
Low
Demand Zone 1
10.784
9.523
Fair Value Gaps / Imbalances
Gap Number
High
Low
Bullish FVG Zone 1
10.964
10.784
4 Hour Timeframe
On the 4-hour chart, prices are currently rejecting from Bearish Fair Value Gap Zone 1 between $11.715-11.350 after failing to break above the 0.382 Fibonacci level at $12.223. This could indicate short term selling pressure.
Supporting Demand Zone 1 between $11.350-10.964 needs to hold to maintain the bullish structure. A break below this zone would shift momentum to bearish. The indicators on this timeframe show weakening bullish momentum.
Fibonacci Retracement Levels
0.382
12.223
0.50
11.982
0.618
11.741
0.786
11.398
0.882
11.203
Demand Zone
Zone Number
High
Low
Demand Zone 1
11.350
10.964
Fair Value Gaps / Imbalances
Gap Number
High
Low
Bearish FVG Zone 1
11.715
11.350
1 Hour Timeframe
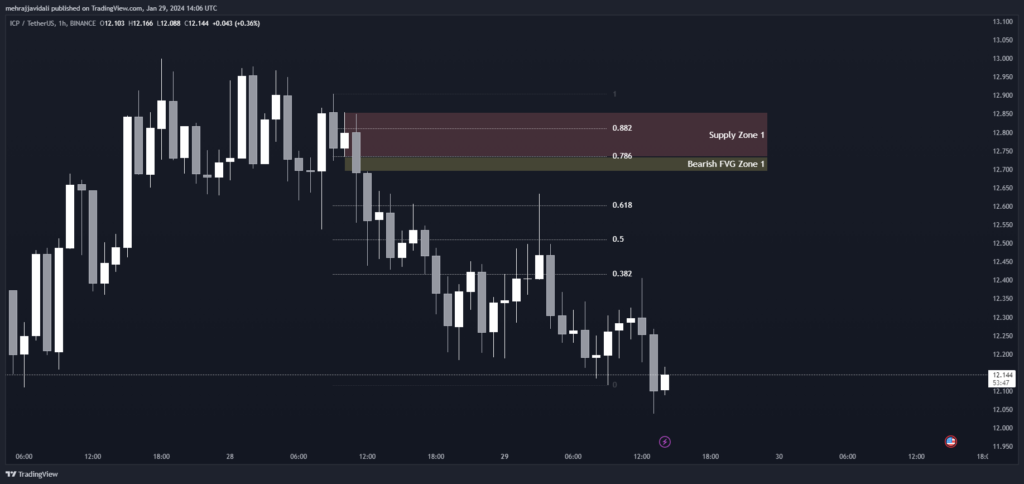
On the 1-hour chart, ICP USDT is facing resistance within Supply Zone 1 between $12.854-12.734 after briefly breaking above the 0.618 Fibonacci retracement level at $12.603.
It has pulled back towards Bearish Fair Value Gap Zone 1 between $12.734-12.695. The technical indicators are giving bearish signals on this timeframe as well. A break below $12.695 could lead to more downside in the short term.