The current price of INJ USDT is trading at $34.06 based on the charts. Looking at the 1 hour chart, the short term trend over the past few days has been downward as price has made a series of lower lows and lower highs.
However, the downward movement does seem to be slowing down and losing momentum as the candlesticks get smaller, indicating indecision in the market.
For a more in-depth technical analysis across different timeframes, please click the link to view the identified levels of support and resistance, trends, and reversal patterns on the weekly, daily and 4 Hour charts.
1 Hour Timeframe
Fibonacci Retracement Levels
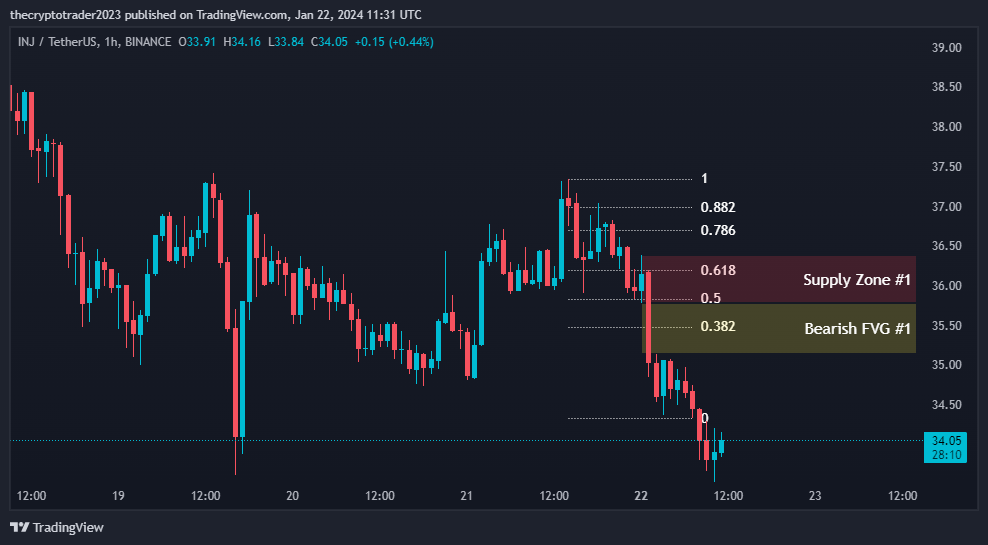
To gain a better understanding of potential support and resistance levels, I have calculated the Fibonacci retracement levels from the most recent swing high to low. The levels are as follows:
- 0.382 fib level at $35.48
- 0.50 fib level at $35.83
- 0.618 fib level at $36.20
- 0.786 fib level at $36.70
- 0.882 fib level at $36.99
These levels provide key upside targets to watch if the downtrend shows signs of reversal or consolidation. The 0.50 and 0.618 levels in particular will likely attract a lot of interest from buyers if price starts to rise up again. On the flip side, if the downtrend continues, these fib levels may now act as overhead resistance.
| 0.382 | 35.48 |
| 0.50 | 35.83 |
| 0.618 | 36.20 |
| 0.786 | 36.70 |
| 0.882 | 36.99 |
Fair Value Gaps / Imbalances
Examining the fair value gaps (FVG) on the chart, there is currently one bearish gap identified between $35.78-35.14. A FVG is an area on the chart where there is an imbalance caused by prices gaps. Sometimes when price revisits these levels, it will close the gap as part of a liquidity restoration process.
This means we could see some short term support holding around the lower boundary of $35.14 of this bearish gap if the current downtrend stalls out. However, given there is only a small 50 pip gap here, it may not provide incredibly strong support on its own.
| Gap Number | High | Low |
| Bearish FVG #1 | 35.78 | 35.14 |
Short Term Support and Resistance In addition to the fib levels and fair value gap, we can also look to recent price action and swings for clues about potential support and resistance in the short term:
Support Levels:
- $34.06 (current price)
- $33.60 (yesterday’s low)
- $33.15 (session low from two days ago)
Resistance Levels:
- $34.50 (multiple recent lower highs)
- $35.00 (psychological whole number level)
- $35.14 (Bearish FVG low boundary)
Looking at the volume profile indicator on the right side, we can see that the highest volume node over the past few weeks sits right around the $34 price level.
This indicates this is an area where a lot of prior trading activity has occurred and could provide interesting support as a result. However, if broken, it signals more downside may follow.
Overall Market Conditions It’s also worth analyzing how larger crypto indexes like BTC and ETH are performing as this will heavily influence altcoin movements. Both BTC and ETH saw a relief rally yesterday but have since stalled, creating indecision in the broader market. If they break lower again, it could put more downward pressure on smaller caps like INJ USDT. On the other hand, a resumption of upside could trigger renewed buying interest across the board.
Trading Plan Based on the above technical analysis, here is a potential 1 hour trading plan for INJ/USDT:
- Look to enter long on a bounce off the $34.06 support with a stop loss placed below structure at $33.60.
- Target takes profits at the Fib 0.382 level of $35.48 and 0.50 level of $35.83.
- Alternatively, wait for price to close a candle above $34.50 resistance before entering long in anticipation of a break of structure and further upside potential.
- Be cognizant of broader market conditions affecting risk sentiment and keep position size tight.
- If support at $34 breaks, prepare to scale out of longs or enter short on a retest of the volume profile node at $34 with a stop above the high of the retest candle.