On the daily timeframe LDO USDT finds itself in a range, with resistance at $3.122 and support between $2.758-$2.914. A break above $3.122 could see a move towards $3.295, while a breakdown below $2.758 targets $2.890 support.
On lower timeframes, short-term traders can look for range bound opportunities between the defined support and resistance zones. Overall, the technical outlook is neutral to bullish as long as price holds above $2.758 support.
Daily Timeframe Analysis
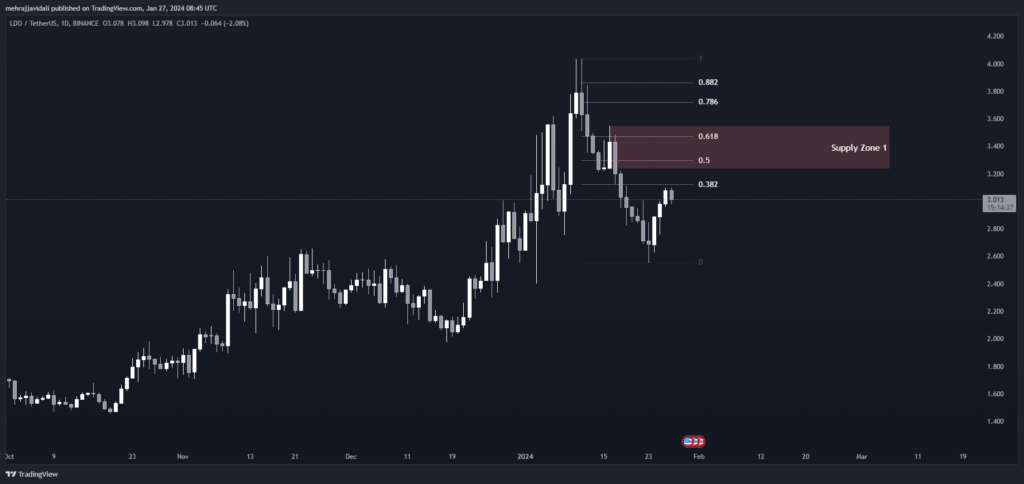
Currently, LDO USDT is trading around $2.999 on the daily timeframe. Let us analyze the key levels of support and resistance for potential trade opportunities.
Fibonacci Retracement Levels
On the daily chart, we can see that price is finding resistance at the first Fibonacci retracement level of 0.382 at $3.122. There is a supply zone between $3.234-$3.549 that may also act as resistance.
If price is able to break above this zone and the 0.382 level, the next levels to watch would be the 0.50 retracement at $3.295 and the 0.618 level at $3.474.
On the downside, the first support comes in at the current price level around $2.999. Below this, subsequent support levels are found at the demand zones.
The nearest demand zone is between $2.758-$2.914. A breakdown below this zone could see price test the 0.618 retracement level at $2.890.
| 0.382 | 3.122 |
| 0.50 | 3.295 |
| 0.618 | 3.474 |
| 0.786 | 3.720 |
| 0.882 | 3.865 |
Supply Zone
| Zone Number | High | Low |
| Supply Zone 1 | 3.549 | 3.234 |
4 Hour Timeframe Analysis
Support and Resistance Levels
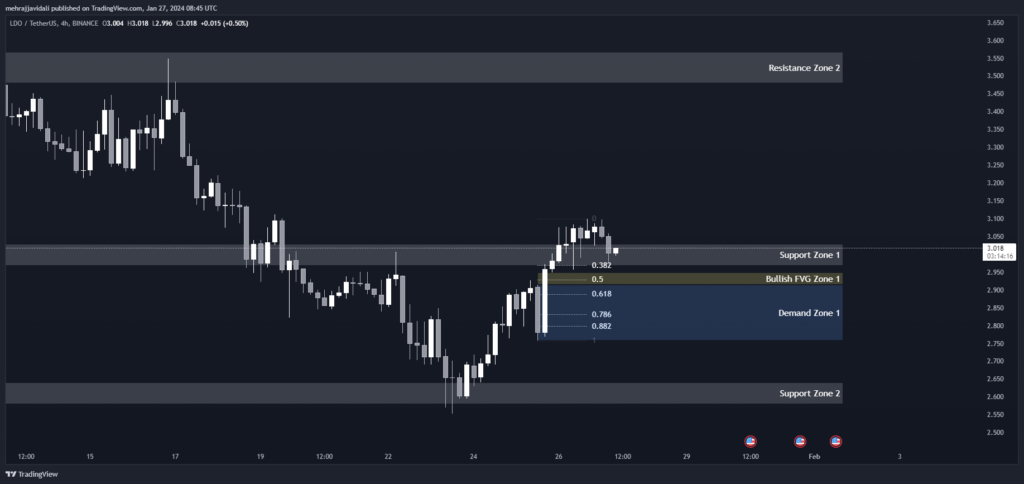
Zooming into the 4-hour chart, we can see price is currently finding support at the first support zone between $2.967-$3.029. However, below this level lies the strong support of the second support zone from $2.580-$2.640.
Resistance lies at the first resistance zone between $3.480-$3.567.
| S / R Type | High | Low |
| Support Zone 1 | 3.029 | 2.967 |
| Support Zone 2 | 2.640 | 2.580 |
| Resistance Zone 1 | 3.567 | 3.480 |
Fibonacci Retracement Levels
From a retracement standpoint, price has pulled back to the 0.382 Fibonacci level at $2.969. The 0.50 level is at $2.928. A break below would target the 0.618 level at $2.890 and the demand zone between $2.758-$2.914.
| 0.382 | 2.969 |
| 0.50 | 2.928 |
| 0.618 | 2.890 |
| 0.786 | 2.831 |
| 0.882 | 2.799 |
Demand Zone
| Zone Number | High | Low |
| Demand Zone 1 | 2.914 | 2.758 |
Fair Value Gaps / Imbalances
| Gap Number | High | Low |
| Bullish FVG Zone 1 | 2.949 | 2.914 |
1 Hour Timeframe Analysis
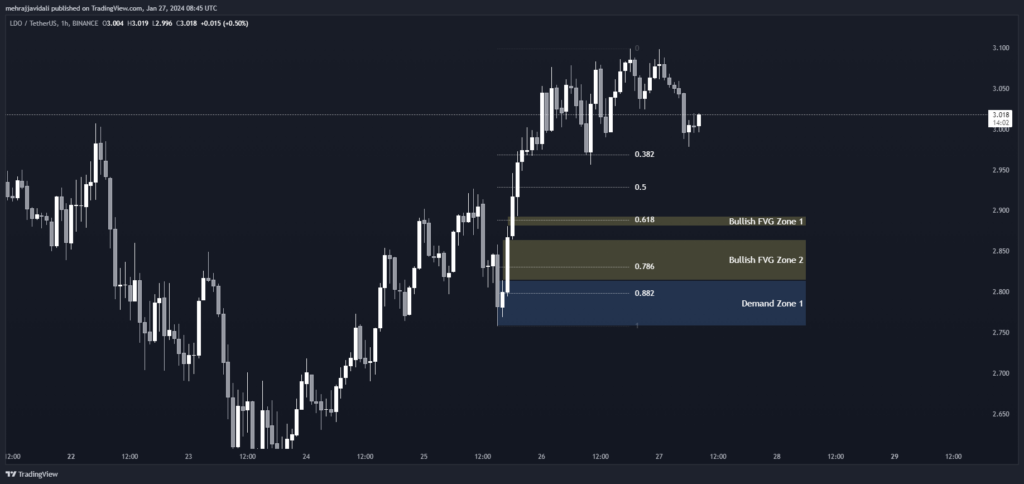
On the 1-hour chart, price is moving within the first demand zone from $2.758-$2.814. Below this zone is the bullish fair value gap zone between $2.814-$2.881. Furthermore, holding above $2.798 at the 0.882 Fibonacci level would keep the near-term bullish momentum intact.
Fibonacci Retracement Levels
| 0.382 | 2.970 |
| 0.50 | 2.928 |
| 0.618 | 2.889 |
| 0.786 | 2.831 |
| 0.882 | 2.798 |
Demand Zone
| Zone Number | High | Low |
| Demand Zone 1 | 2.814 | 2.758 |
Fair Value Gaps / Imbalances
| Gap Number | High | Low |
| Bullish FVG Zone 1 | 2.893 | 2.881 |
| Bullish FVG Zone 2 | 2.864 | 2.814 |