Lido LDO USDT is currently showing signs of upside momentum on lower timeframes below daily. Immediate resistance lies at 3.234-3.213 on 1-hour and 3.549-3.376 on 4-hour charts.
As long as the price holds above 0.618 Fibonacci retracement levels, the short-term bullish structure remains intact.
A weekly close above 4.036-3.890 resistance zone could spark a rally towards the 0.786 and 0.882 targets of 2.426 and 2.222 respectively.
Weekly Timeframe
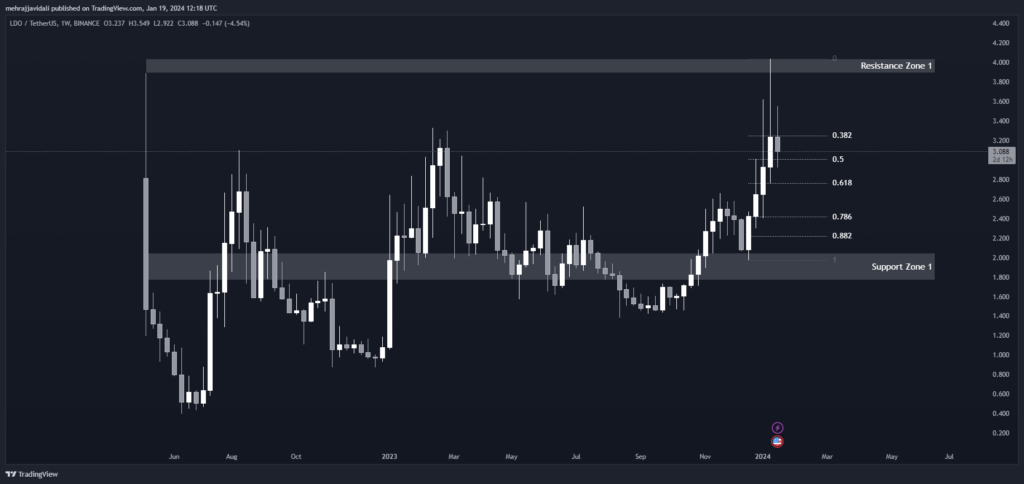
On the weekly timeframe, we can see that Lido (LDO USDT) has found strong resistance in the zone between 4.036-3.890 (Resistance Zone 1) after rallying up from the support zone between 2.046-1.763 (Support Zone 1).
The price is currently finding support around the 0.618 Fibonacci retracement level of 2.762 after pulling back from Resistance Zone 1.
If the bulls can push the price back above Resistance Zone 1, we may see further upside toward the 0.786 and 0.882 Fibonacci extension levels of 2.426 and 2.222 respectively.
However, a weekly close below 0.618 Fibonacci retracement level would weaken the current uptrend.
Support and Resistance Levels
| S / R Type | High | Low |
| Resistance Zone 1 | 4.036 | 3.890 |
| Support Zone 1 | 2.046 | 1.763 |
Fibonacci Retracement Levels
| 0.382 | 3.252 |
| 0.50 | 3.007 |
| 0.618 | 2.762 |
| 0.786 | 2.426 |
| 0.882 | 2.222 |
Daily Timeframe
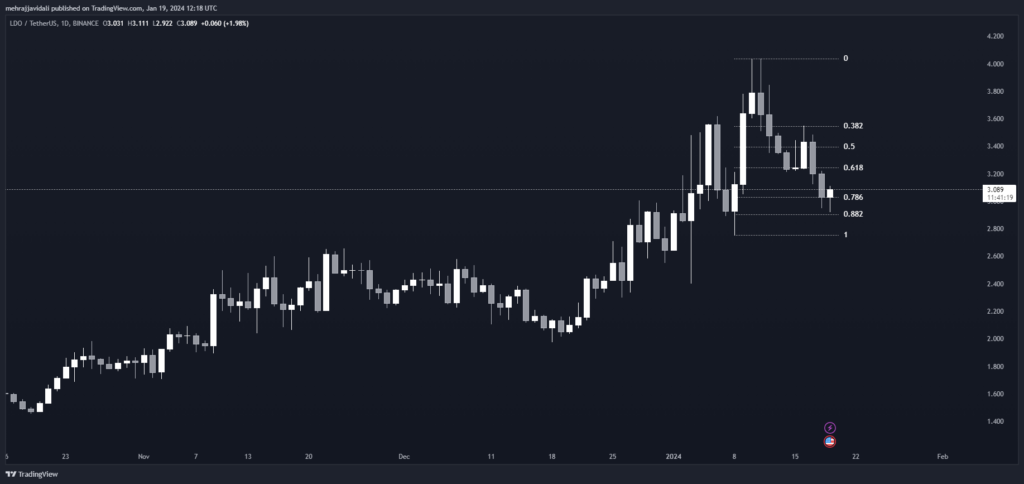
Looking at the daily chart, we can observe that LDO USDT is currently trapped between the 0.618 Fibonacci retracement level of 3.247 and the 0.382 level of 3.547.
The 0.618 level has provided strong support over the past month, indicating this area is being defended well by buyers. However, resistance lies at the 0.382 and 0.50 levels above at 3.547 and 3.395 respectively.
A daily close above these resistance levels could lead to a continuation of the uptrend with potential resistance at Supply Zone 1 between 3.549-3.376.
On the downside, a break below 0.618 Fibonacci retracement level of 3.247 on heavy volume would signal a weakness in the bullish momentum.
Fibonacci Retracement Levels
| 0.382 | 3.547 |
| 0.50 | 3.395 |
| 0.618 | 3.247 |
| 0.786 | 3.032 |
| 0.882 | 2.906 |
4 Hour Timeframe
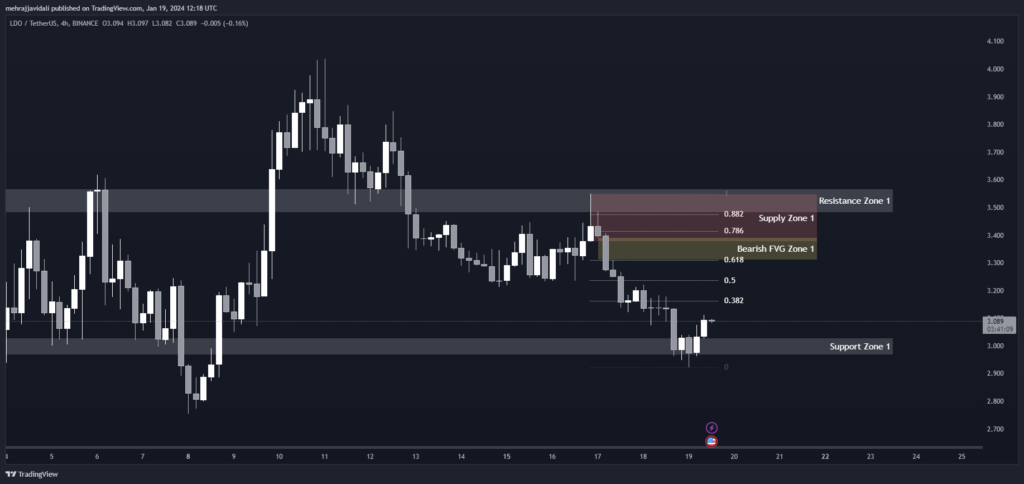
On the 4-hour timeframe, we can see Lido is currently finding support at Resistance Zone 1 between 3.029-2.967 after facing rejection from Resistance Zone 1 between 3.567-3.480.
Immediate resistance lies at Supply Zone 1 between 3.549-3.376. The 0.618 and 0.786 Fibonacci retracement levels between 3.308-3.416 will act as important support zones going forward.
A break above Supply Zone 1 could open up upside toward the 0.882 Fibonacci extension level of 3.476. However, a break below 0.618 Fibonacci level would weaken the short-term bullish structure.
Support and Resistance Levels
| S / R Type | High | Low |
| Resistance Zone 1 | 3.567 | 3.480 |
| Support Zone 1 | 3.029 | 2.967 |
| Support Zone 2 | 2.520 | 2.640 |
Fibonacci Retracement Levels
| 0.382 | 3.162 |
| 0.50 | 3.234 |
| 0.618 | 3.308 |
| 0.786 | 3.416 |
| 0.882 | 3.476 |
Supply Zone
| Zone Number | High | Low |
| Supply Zone 1 | 3.549 | 3.376 |
Fair Value Gaps / Imbalances
| Gap Number | High | Low |
| Bearish FVG Zone 1 | 3.391 | 3.310 |
1 Hour Timeframe
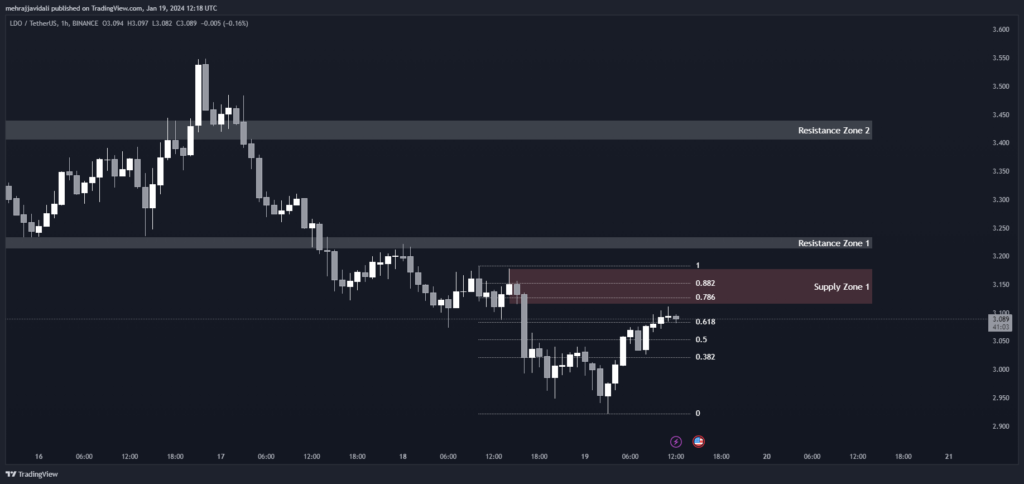
Looking at the 1-hour chart, we can see Lido is currently trapped between Resistance Zone 1 between 3.234-3.213 and Resistance Zone 2 between 3.440-3.405 after facing rejection from Supply Zone 1 between 3.178-3.115.
The price is finding immediate support at the 0.618 Fibonacci retracement level of 3.083. A break above Resistance Zone 2 could see the price rise toward the 0.786 Fibonacci extension level of 3.128.
On the flipside, a break below 0.618 Fibonacci level would expose the 0.382 support level at 3.022 to more downside.
Support and Resistance Levels
| S / R Type | High | Low |
| Resistance Zone 1 | 3.234 | 3.213 |
| Resistance Zone 2 | 3.440 | 3.405 |
Fibonacci Retracement Levels
| 0.382 | 3.022 |
| 0.50 | 3.053 |
| 0.618 | 3.083 |
| 0.786 | 3.128 |
| 0.882 | 3.152 |
Supply Zone
| Zone Number | High | Low |
| Supply Zone 1 | 3.178 | 3.115 |