Both the 4-hour and 1-hour timeframes are providing resistance for LDO USDT currently. Short term momentum has turned bearish below key levels on the smaller timeframe.
A break of support signals seen on either chart could lead to a deeper pullback in the near term. Upside potential exists on a break above the Supply Zones, though momentum would need to improve for a sustained rally.
4 Hour Timeframe
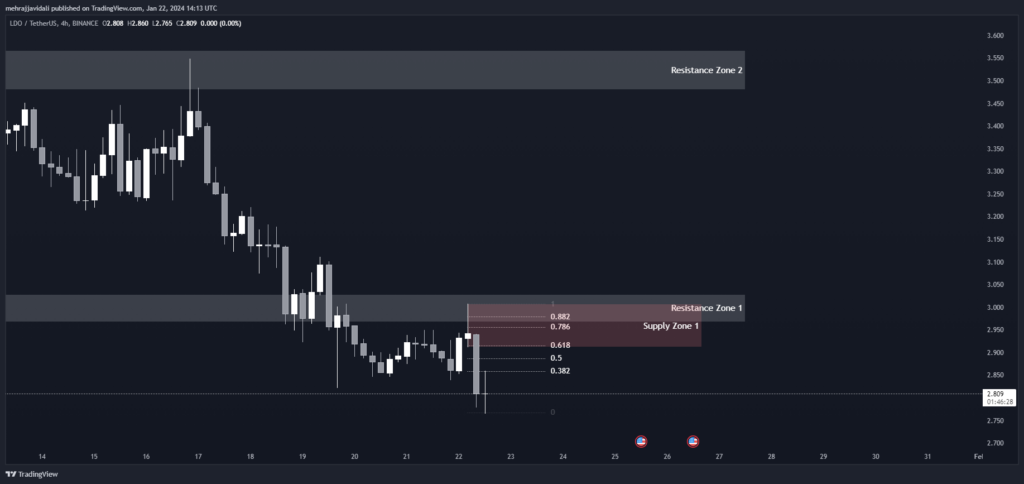
On the 4-hour chart, LDO USDT can be seen trading within a Resistance Zone between $2.967 – $3.029. This zone lines up with a Supply Zone 1 from $2.912 – $3.007 as well.
The price currently sits just below this zone after retracing from the highs. Fibonacci retracement levels show potential support comes in between $2.859 – $2.979. A break below the 0.382 Fibonacci level of $2.859 could see further downside potential in the near term.
Conversely, a break above the Supply Zone high of $3.007 could lead to an extended rally with resistance then coming in around $3.29 based on previous price action.
Overall, the 4-hour timeframe is currently bearish in the short term with resistance above and support below currently being tested. A break of either level would give clues as to the next potential directional move.
Support and Resistance Levels
| S / R Type | High | Low |
| Resistance Zone 1 | 3.029 | 2.967 |
Fibonacci Retracement Levels
| 0.382 | 2.859 |
| 0.50 | 2.887 |
| 0.618 | 2.915 |
| 0.786 | 2.956 |
| 0.882 | 2.979 |
Supply Zone
| Zone Number | High | Low |
| Supply Zone 1 | 3.007 | 2.912 |
1 Hour Timeframe
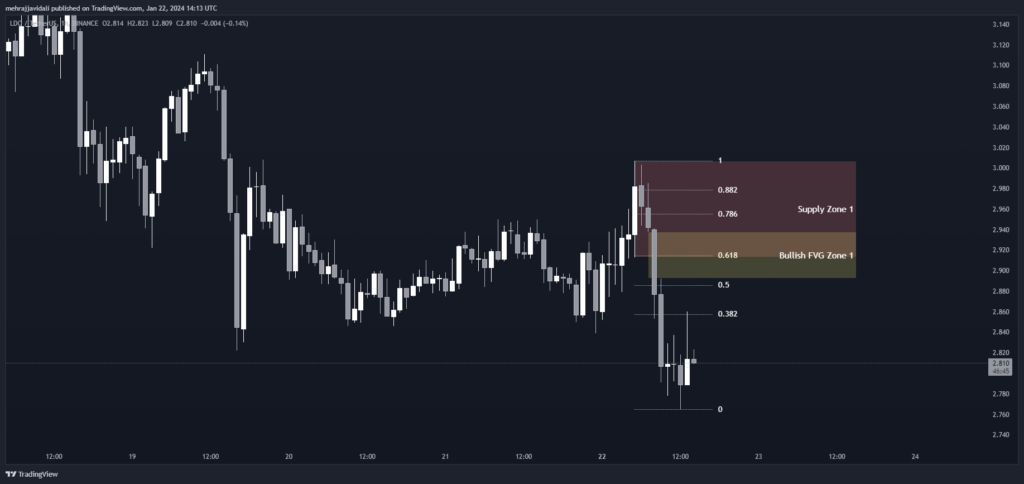
Drilling down to the 1-hour chart, the picture is similar with resistance seen from the Supply Zone 1 high of $3.007 down to support at $2.913. Fibonacci retracement levels line up closely with this zone. Short term momentum appears to be shifting to the downside below the key 50% Fibonacci level of $2.886 currently.
A Bearish Fair Value Gap (BFVG) zone from $2.938 – $2.892 could provide potential support for any further downside in the near term as well. However, a break below the BFVG and the 0.382 Fibonacci level could lead to a retest of the 1-hour chart lows around $2.76.
Bulls will want to see a recovery back above the 1-hour 21 EMA (currently $2.848) and 50% Fibonacci to regain some upside momentum. From there, a break back above the 1-hour Supply Zone high could target a move back up to resistance at $3.007 initially.
Fibonacci Retracement Levels
| 0.382 | 2.857 |
| 0.50 | 2.886 |
| 0.618 | 2.915 |
| 0.786 | 2.955 |
| 0.882 | 2.978 |
Supply Zone
| Zone Number | High | Low |
| Supply Zone 1 | 3.007 | 2.913 |
Fair Value Gaps / Imbalances
| Gap Number | High | Low |
| Bullish FVG Zone 1 | 2.938 | 2.892 |