Chainlink (LINK USDT) appears to be consolidating in the near term across timeframes, the technical picture remains constructive with multiple demand zones, FVG’s and Fibonacci levels supportive of an eventual breakout to the upside on a close above key resistance levels.
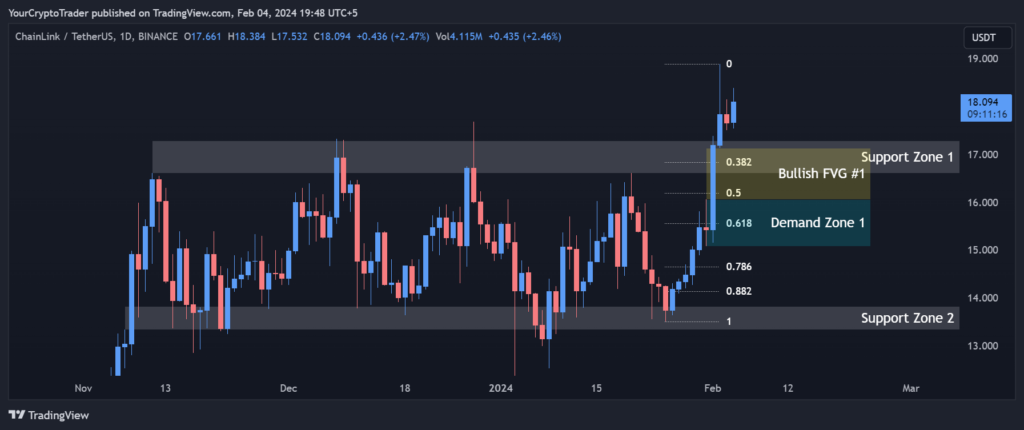
LINK USDT is currently trading within the Support Zone 1 range of $16,600-$17,288. It finds strong support at this zone, which lines up well with Demand Zone 1 of $16,060-$15,083. The 0.382, 0.50 and 0.618 Fibonacci retracement levels from the recent swing high also fall within this support area, adding confluence.
Furthermore, Bullish Fair Value Gap #1 between $16,060- $17,132 could potentially drive prices higher once filled. Overall, the daily chart suggests continued sideways consolidation within Support Zone 1 in the near term.
Support and Resistance Levels
S / R Type
High
Low
Support Zone 1
16.600
17.288
Support Zone 2
13.340
13.824
Fibonacci Retracement Levels
0.382
16.828
0.50
16.193
0.618
15.561
0.786
14.653
0.882
14.144
Demand Zone
Zone Number
High
Low
Demand Zone 1
16.060
15.083
Fair Value Gaps / Imbalances
Gap Number
High
Low
Bullish FVG #1
16.060
17.132
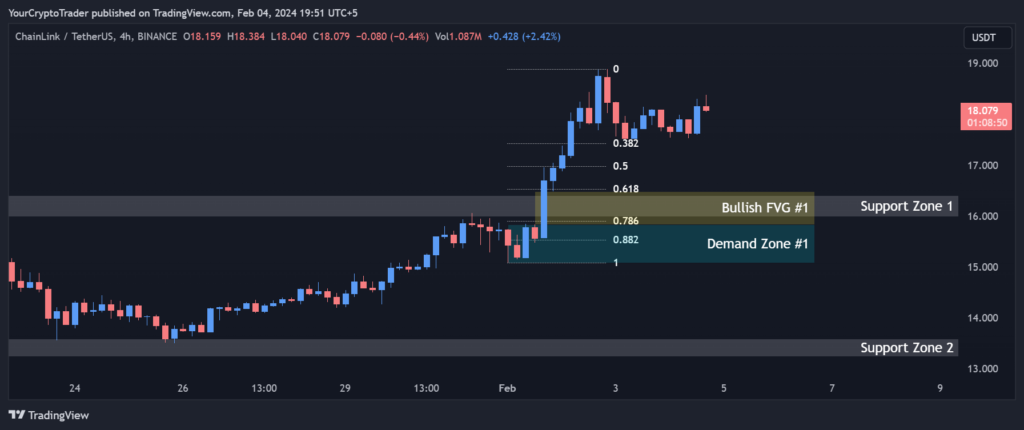
4 Hour Timeframe
In the 4-hour chart of LINK USDT, we can see the price is hovering just above Support Zone 1 of $15,990-$16,405. It is currently facing resistance at Local Resistance between $14,656-$14,781.
A break above this level could see it test the 0.382 and 0.50 Fibonacci levels at $17,430 and $16,983 respectively.
Below, strong support lies at Demand Zone #1 from $15,829-$15,083. Bullish Fair Value Gap #1 from $15,829-$16,480 also reinforces this area if retested.
The 4-hour momentum indicators are drifting lower, suggesting more range-bound trading is likely in the short term.
Support and Resistance Levels
S / R Type
High
Low
Support Zone 1
15.990
16.405
Support Zone 2
13.589
13.240
Local Resistance Levels
Type
High
Low
Local Resistance
14.656
14.781
Fibonacci Retracement Levels
0.382
17.430
0.50
16.983
0.618
16.531
0.786
15.898
0.882
15.534
Demand Zone
Zone Number
High
Low
Demand Zone #1
15.829
15.083
Fair Value Gaps / Imbalances
Gap Number
High
Low
Bullish FVG #1
15.829
16.480
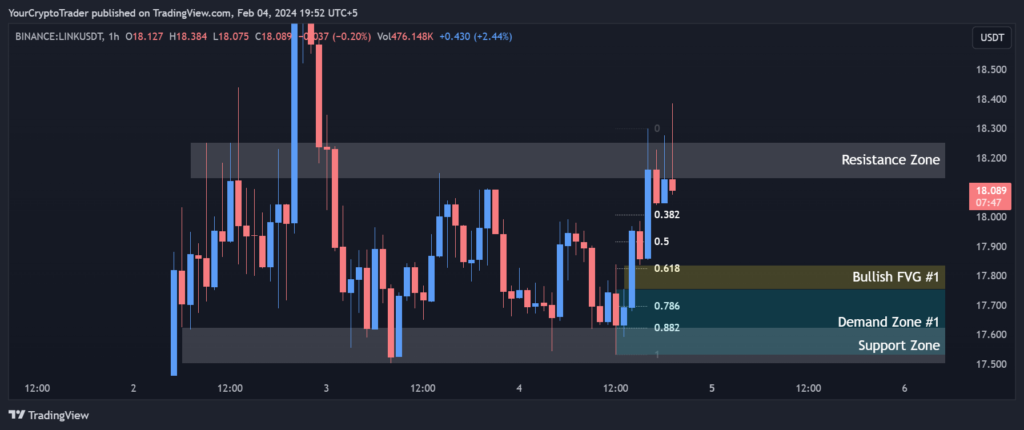
1 Hour Timeframe
In the 1-hour timeframe of LINK USDT, price action has tightened into a symmetrical triangle pattern between Support Zone of $17,624-$17,502 and Resistance Zone of $18,253-$18,131. It is currently hovering just below the 0.618 Fibonacci level at $17,824.
A convincing break above Resistance Zone could expose Bullish Fair Value Gap #1 from $17,754-$17,836. Below, Support Zone and Demand Zone #1 from $17,754-$17,532 provide strong floors. The short-term momentum is neutral.
A break of either side of the triangle will likely dictate the near-term direction.