Current Price Action and Trend: The 4-hour chart shows that LINK USDT is currently trading within a volatile uptrend after breaking above the 0.618 Fibonacci retracement level of 18.370 earlier this week. Although there was a temporary pullback to fill the fair value gap between 18.053-18.402, buying pressure has since prevailed and pushed the price up to its current level of 19.194. This represents an approximate 5% gain from the local lows. Overall technical indicators are signaling further upside potential in the near term.
4 Hour Timeframe
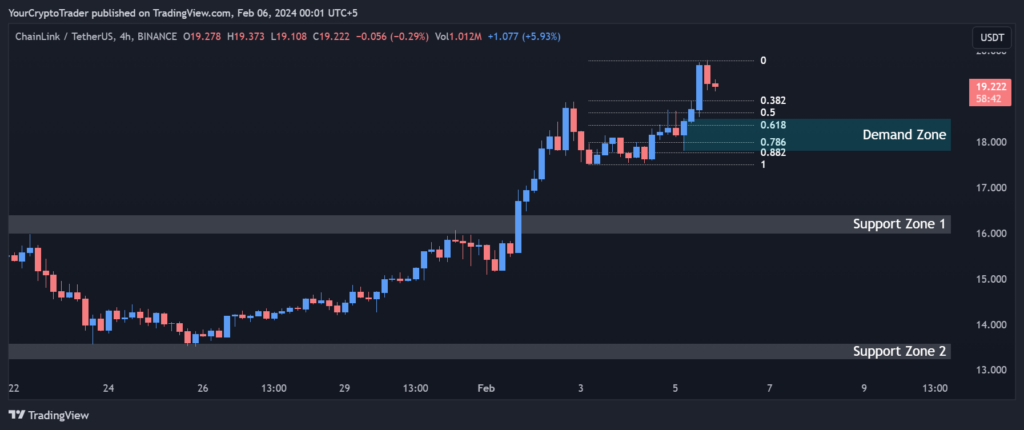
On the 4-hour chart, LINK USDT finds strong support between 15.990-16.405. Below this zone, the 0.382 Fibonacci retracement level at 15.193 provides an additional floor of potential buying interest. On the upside, resistance lies between 18.193-18.370 – an area defined by the 0.382 and 0.618 Fibonacci retracement levels respectively. A firm break above this resistance would confirm the ongoing bullish momentum and potentially spark a move towards the next resistance zone between 18.640-18.740, defined by the 0.50 and 0.618 Fibonacci levels.
A bullish demand zone has also formed between 18.517-17.806. This demand zone saw multiple retests of support in the past week and will likely attract accumulation on any temporary pullbacks moving forward. Overall, as long as LINK USDT remains above the psychological support level of 15, the 4-hour timeframe is positive.
Support and Resistance Levels
| S / R Type | High | Low |
| Support Zone 1 | 15.990 | 16.405 |
| Support Zone 2 | 13.589 | 13.240 |
Fibonacci Retracement Levels
| 0.382 | 18.193 |
| 0.50 | 18.640 |
| 0.618 | 18.370 |
| 0.786 | 17.990 |
| 0.882 | 17.772 |
Demand Zone
| Zone Number | High | Low |
| Demand Zone #1 | 18.517 | 17.806 |
1 Hour Timeframe
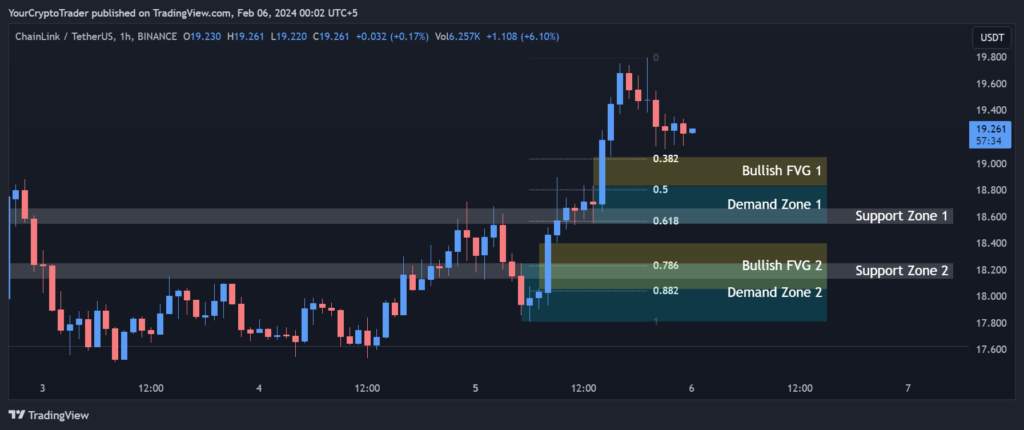
On the shorter 1-hour timeframe, immediate support lies at 18.543-18.665. Below this, subsequent support zones exist at 18.131-18.253 and 17.624. The latter zone coincides with the 0.618 Fibonacci retracement level and is a key level to hold. On the upside, resistance is seen at 19.038-19.052, defined by the 0.382 Fibonacci level and a bullish fair value gap.
Bullish momentum could accelerate on a firm break above this resistance, opening the doors towards the next resistance zones between 18.799-18.831 and 18.566. Multiple bullish demand zones have also formed between 18.549-18.831 and 17.806-18.245 which are likely to attract fresh buying on any dips.
Support and Resistance Levels
| S / R Type | High | Low |
| Support Zone 1 | 18.665 | 18.543 |
| Support Zone 2 | 18.253 | 18.131 |
| Support Zone 3 | 17.624 | 17.624 |
Fibonacci Retracement Levels
| 0.382 | 19.038 |
| 0.50 | 18.799 |
| 0.618 | 18.566 |
| 0.786 | 18.231 |
| 0.882 | 18.038 |
Demand Zone
| Zone Number | High | Low |
| Demand Zone 1 | 18.831 | 18.549 |
| Demand Zone 2 | 18.245 | 17.806 |
Fair Value Gaps / Imbalances
| Gap Number | High | Low |
| Bullish FVG 1 | 18.831 | 19.052 |
| Bullish FVG 2 | 18.053 | 18.402 |
Overall Market Structure and Outlook: Based on the above analysis of both timeframes, the market structure for LINK USDT remains constructively bullish above 17.624. Price action continues to make higher highs and lows within an uptrending channel on the daily timeframe (not shown). Established demand zones and the 0.618 Fibonacci level between 17.624-18.370 will be important floors of support to hold.
A break above the 1-hour resistance zone at 19.038-19.052 could ignite another leg higher towards the next potential upside targets of 19.40 and 20. Short term traders may look to enter on dips to demand zones or buy breakouts of key resistance levels, while maintaining a protective stop below the aforementioned support levels. Barring any unexpected negative crypto news flow, further upside cannot be ruled out over the coming weeks.