The current price of LINK USDT is 18.558 USDT, hovering just above the upper boundary of the first identified support zone between 18.543-18.665 USDT. This suggests the market is finding buying pressure and demand in this area, supported by the 0.382 Fibonacci retracement level of 18.714 USDT. However, LINK is yet to break above the overhead resistance of the 19.065-19.316 USDT supply zone.
The current technical structure and short term momentum remains positive for LINK as long as it holds above the key support levels. A push above the supply zone resistance could see the start of the next leg up within the context of the broader uptrend on higher timeframes. Intraday traders have potential swing trade setups to take advantage of based on the outlined support and resistance levels. Downside risks need to be managed closely with tight stop losses.
1 Hour Timeframe
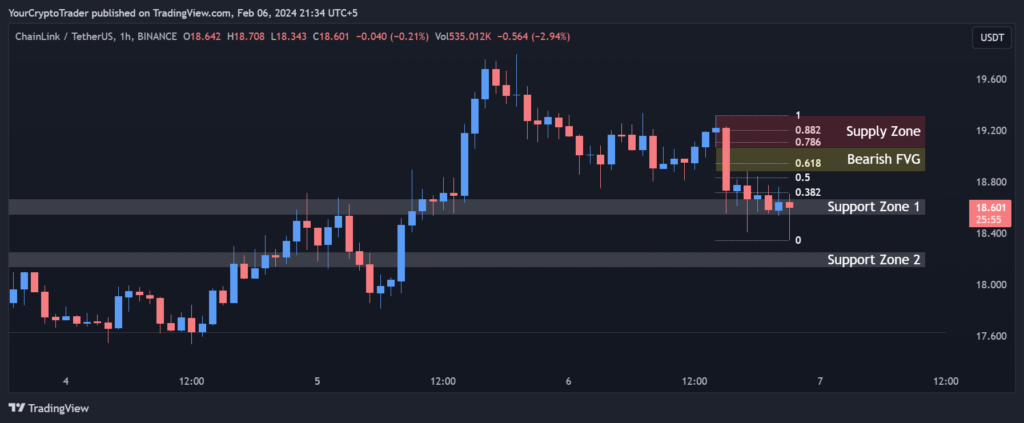
We can see LINK USDT formed a bullish engulfing candlestick pattern yesterday around 18.2 USDT as buyers stepped in and absorbed selling pressure, confirming the support level in that area. Since then, the price has been trending higher inside an ascending channel formation. Volume has been increasing on the uptrend, another bullish signal. If buyers can push the price above the supply zone, we may see the start of a new impulsive leg up targeting the 0.5 and 0.618 Fibonacci retracement levels at 18.830 and 18.944 USDT respectively.
Trading Opportunities
For traders looking to take advantage of intraday swings, buy positions could be initiated on a bounce from Support Zone 1 or a successful retest of the upper boundary, with profit targets at the 0.5 and 0.618 Fibonacci levels. Stop losses would be placed below Support Zone 2 to protect against an unexpected breakdown. Short term sellers may look to enter positions if there is a 4 hourly candle close below Support Zone 1, targeting a move into Support Zone 2 and potentially lower if selling momentum builds. Strict stop losses would need to be used in case the trend reverses upwards again.
Support and Resistance Levels
In the near term, the first support level to watch is the lower boundary of Support Zone 1 between 18.543-18.665 USDT. A break below here could see selling pressure accelerate towards Support Zone 2 between 18.253-18.131 USDT. Holding above Support Zone 1 keeps the bullish short term outlook intact. On the upside, a sustained break above the 19.065-19.316 USDT Supply Zone is needed to signal the next push higher. The bearish FVG between 19.065-18.879 USDT also needs to be overcome for continuation of the current uptrend.
| S / R Type | High | Low |
| Support Zone 1 | 18.665 | 18.543 |
| Support Zone 2 | 18.253 | 18.131 |
| Support Zone 3 | 17.624 | 17.624 |
Fibonacci Retracement Levels
| 0.382 | 18.714 |
| 0.50 | 18.830 |
| 0.618 | 18.944 |
| 0.786 | 19.109 |
| 0.882 | 19.201 |
Supply Zone
| Zone Number | High | Low |
| Supply Zone 1 | 19.065 | 19.316 |
Fair Value Gaps / Imbalances
| Gap Number | High | Low |
| Bearish FVG | 19.065 | 18.879 |