LINK USDT remains pointed upwards as long as several crucial support levels remain intact. With several potential demand areas laying below, downside appears limited for now. Traders can look to enter lightly on support tests or wait for momentum to turn higher again.
1 Hour Timeframe
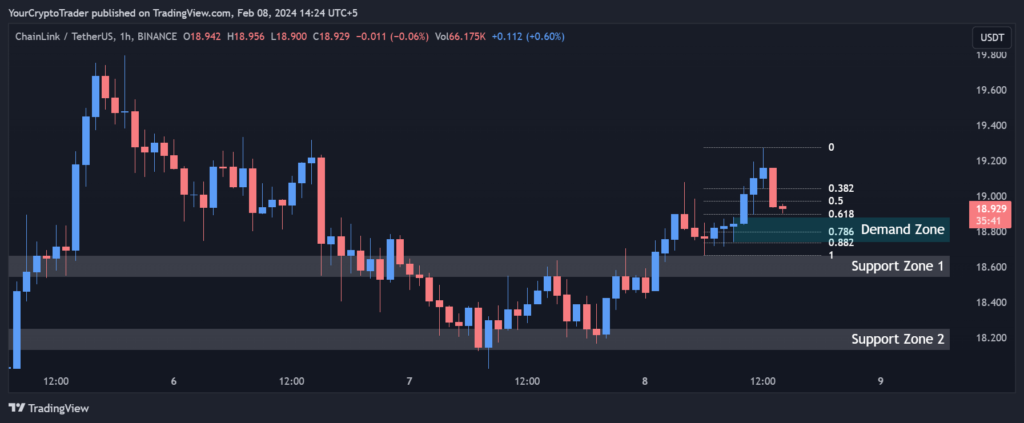
Chainlink LINK USDT is displaying some technical signs of consolidation after a continued period of bullish price action. The current price is trading between the key support zones at 18.665 – 18.543 and 18.253 – 18.131.
Support and Resistance Levels
Holding above these support levels will be important for maintaining near term bullish structure. A break below 18.131 support could shift the bias to neutral or bearish on the shorter timeframes.
| S / R Type | High | Low |
| Support Zone 1 | 18.665 | 18.543 |
| Support Zone 2 | 18.253 | 18.131 |
Fibonacci Retracement Levels
Fibonacci retracement levels provide indications of potential areas where buying interest may emerge again. The 0.382, 0.50 and 0.618 levels at 19.042, 18.970 and 18.897 act as resistance turned support in times of correction.
| 0.382 | 19.042 |
| 0.50 | 18.970 |
| 0.618 | 18.897 |
| 0.786 | 18.795 |
| 0.882 | 18.735 |
Demand Zone
The demand zone between 18.881 – 18.740 could prove to be an area which buyers step in, potentially halting or reversing a downward move from support if tested.
| Zone Number | High | Low |
| Demand Zone | 18.881 | 18.740 |
The overall bullish structure is still intact provided we continue to see higher lows being set. Link may form some type of sideways trading range or consolidation pattern between the key support and resistance levels over the coming sessions. This would be a healthy development after the recent bullish run.