The daily time frame LINK USDT paints a neutral medium term picture, the hourly and 4-hourly time frames show bullish near term structure as long as the support zones on these lower time frames hold. A break below the daily support zone 1 at $16.6k would weaken the overall outlook significantly. Upside appears limited between $16k-18k currently based on demand and supply zones.
Daily Timeframe
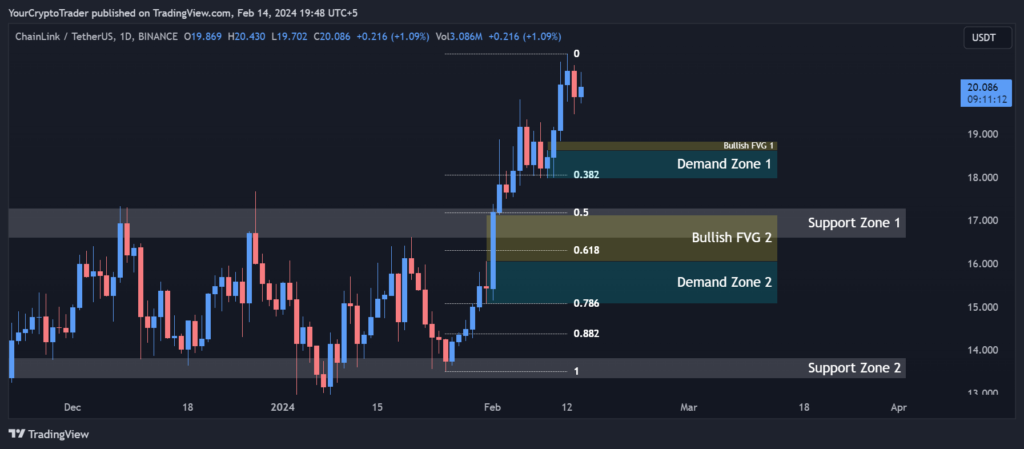
On the daily time frame, LINK USDT is currently trading at $20.052. From the daily support and resistance levels we can see that the price is situated right above an important support zone 1 between $16.600 – $17.288. If this zone is broken to the downside it will indicate further bearish momentum.
Support and Resistance Levels
| S / R Type | High | Low |
| Support Zone 1 | 16.600 | 17.288 |
| Support Zone 2 | 13.340 | 13.824 |
Fibonacci Retracement Levels
Looking at the daily Fibonacci retracement levels, the 0.618 level at $16.319 lines up very well with the top of support zone 1, adding confirmation of its importance. The 0.618 level is a key retracement point that often halts retracement moves.
| 0.382 | 18.056 |
| 0.50 | 17.192 |
| 0.618 | 16.319 |
| 0.786 | 15.073 |
| 0.882 | 14.373 |
Demand Zone
Examining the daily demand zones, we can see the price is currently trading in between the demand zone 1 high of $18.625 and demand zone 2 high of $16.060. This suggests the current price area between $16k-$18k is an area of interest where demand may step in.
| Zone Number | High | Low |
| Demand Zone 1 | 18.625 | 17.973 |
| Demand Zone 2 | 16.060 | 15.083 |
Fair Value Gaps / Imbalances
Analyzing the daily fair value gaps, we see bullish gaps below at $18.625-$18.829 and $16.060-$17.132. These isolated gaps tend to attract buyers who want to fill the gap, providing support.
| Gap Number | High | Low |
| Bullish FVG 1 | 18.625 | 18.829 |
| Bullish FVG 2 | 16.060 | 17.132 |
4 Hour Timeframe
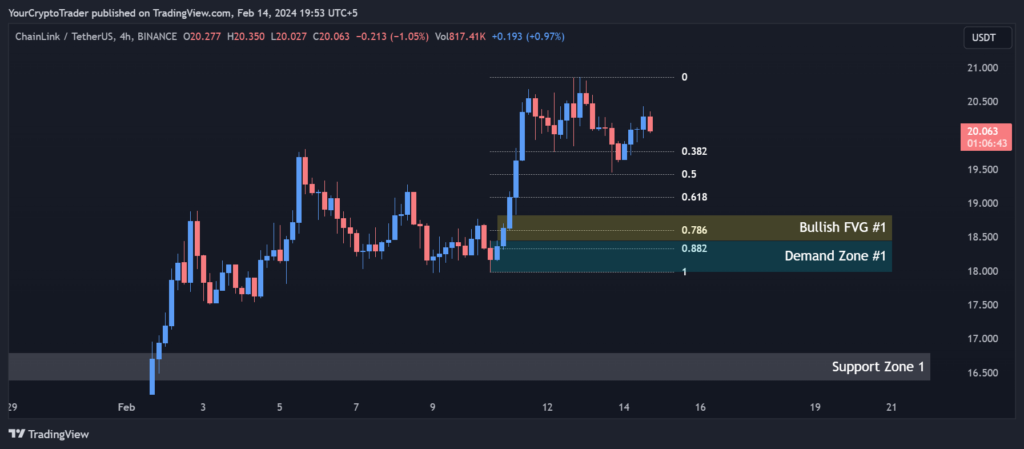
Moving to the 4-hour time frame, we can see LINK USDT is trading above support zone 1 between $16.379-$16.794. A break below here would signal a weaker near term outlook.
Support and Resistance Levels
| S / R Type | High | Low |
| Support Zone 1 | 16.379 | 16.794 |
| Support Zone 2 | 13.589 | 13.240 |
Fibonacci Retracement Levels
The 4-hour Fibonacci retracement levels provide upside extension targets, with the first being the 0.618 level at $19.081. Holding above here keeps the near term trend intact.
| 0.382 | 19.762 |
| 0.50 | 19.429 |
| 0.618 | 19.081 |
| 0.786 | 18.605 |
| 0.882 | 18.320 |
Demand Zone
Examining the 4-hour demand zone, we see the current price action is settled within this zone between $18.446- $17.986. Demand is likely to step in within this zone supporting prices.
| Zone Number | High | Low |
| Demand Zone | 18.446 | 17.986 |
Fair Value Gaps / Imbalances
| Gap Number | High | Low |
| Bullish FVG | 18.448 | 18.829 |
1 Hour Timeframe
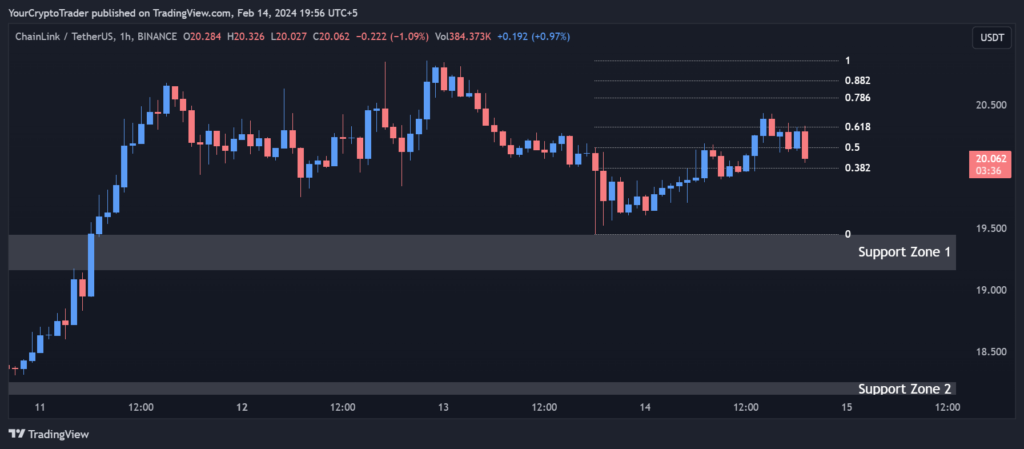
Looking at the 1-hour time frame, support zone 1 between $19.450-$19.158 and support zone 2 between $18.253-$18.131 will be key levels to hold to maintain the bullish structure. A breakdown below here on increasing selling volume would weaken the short term bullish outlook.
Support and Resistance Levels
| S / R Type | High | Low |
| Support Zone 1 | 19.450 | 19.158 |
| Support Zone 2 | 18.253 | 18.131 |
Fibonacci Retracement Levels
The 1-hour Fibonacci retracement levels provide near term upside targets with the first being the 0.618 level at $20.319. Closing hourly or 4-hour candles above here would signal further upside momentum in the short term.
| 0.382 | 19.983 |
| 0.50 | 20.155 |
| 0.618 | 20.319 |
| 0.786 | 20.555 |
| 0.882 | 20.693 |