Chainlink (LINK USDT) remains in an overall bullish trend as long as it holds support at $19.158-18.253 and closes above the $20.286 resistance zone. Upside targets lie between $20.434-21.00 whereas downside pressure could emerge on a breakdown below $18.131. Traders can buy on dips towards the support levels and book profits closer to the resistance zones
LINK USDT is currently trading at $19.905. Based on the support and resistance levels, EMA levels and volume profile provided, here is the technical analysis:
LINK USDT Technical Analysis
Support Levels
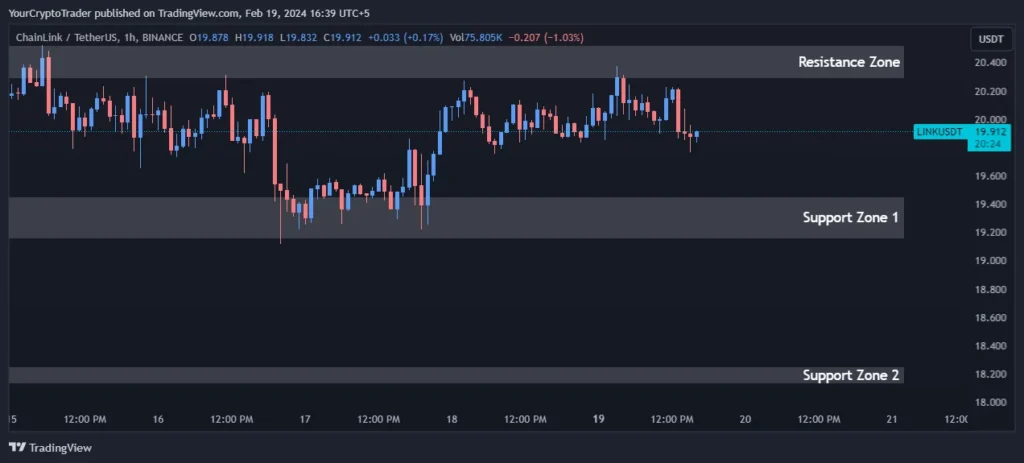
The coin has strong support at $19.158-19.450 (Support Zone 1) and $18.131-18.253 (Support Zone 2). If the price breaks below these levels, it would indicate a bearish sentiment in the market.
| Support Zone Number | Price High | Price Low |
| Support Zone 1 | 19.450 | 19.158 |
| Support Zone 2 | 18.253 | 18.131 |
Resistance Levels
There is an immediate resistance zone between $20.286-20.524. For the price to turn bullish again and continue the uptrend, it needs to closeAbove this resistance zone.
| Resistance Zone Number | Price High | Price Low |
| Resistance Zone | 20.524 | 20.286 |
Exponential Moving Averages (EMA) Levels
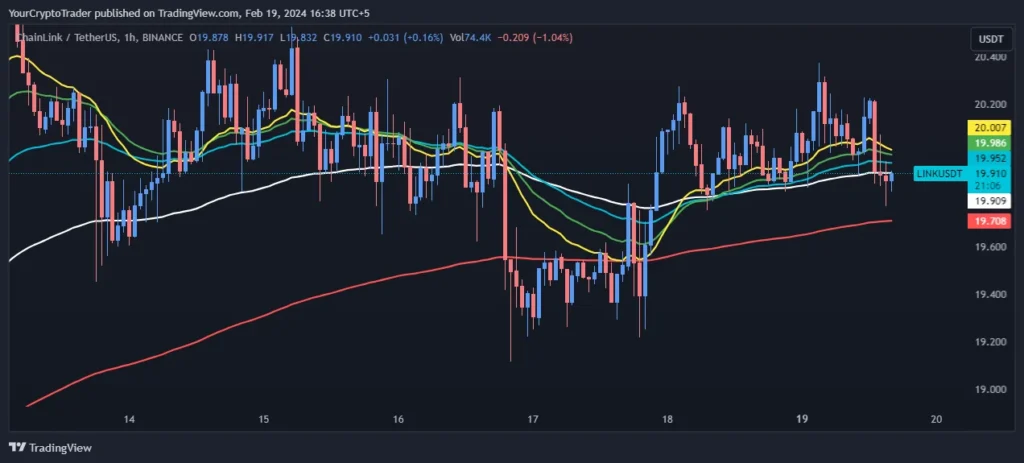
The short term moving averages of 21,34 and 55 EMAs are above the longer term 100 and 200 EMAs indicating an upside momentum. As long as the price remains above the 200 EMA, the bulls remain in control of the short term trend.
| EMA Type | EMA Price on Chart |
| 200 EMA (Red Color) | 19.708 |
| 100 EMA (White Color) | 19.909 |
| 55 EMA (Blue Color) | 19.951 |
| 34 EMA (Green Color) | 19.986 |
| 21 EMA (Yellow Color) | 20.007 |
Fixed Range Volume Profile Levels
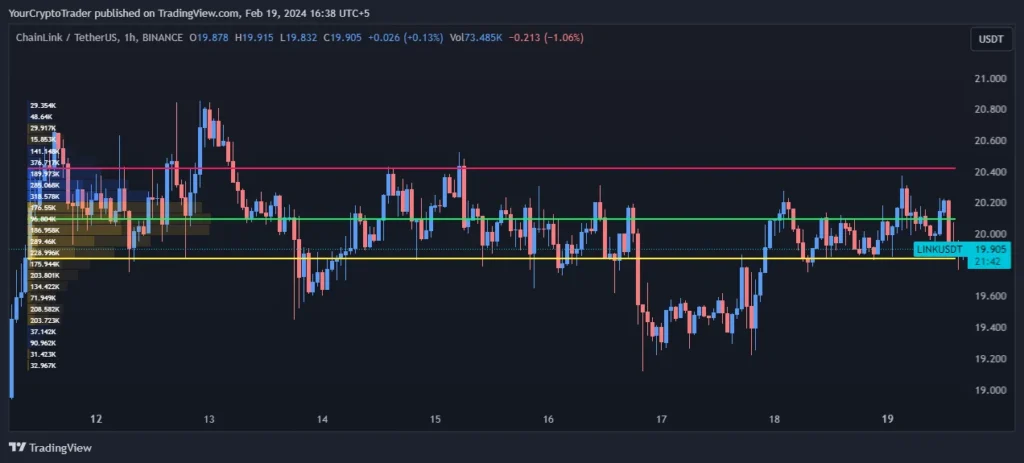
The volume nodes suggest $20.102 as the Point of Control (POC) which is the “fair” value according to price action and volumes traded at those levels. Above the POC, there is strong resistance between $20.434-20.102 denoted by the Value Area High (VAH).
| Point of Control (POC) | Value Area High (VAH) | Value Area Low (VAL) |
| 20.102 | 20.434 | 19.836 |