Chainlink LINK USDT has found itself in an interesting position over the past few months. After seeing massive gains throughout 2021, LINK entered a prolonged period of consolidation in 2022. However, recent price action suggests the market may be ready to resume the uptrend. In this weekly technical analysis, we will take an in-depth look at the various support, resistance, and trend indicator levels to determine the likely next major move for LINK USDT.
LINK USDT short-term momentum appears exhausted, LINK’s structure remains constructively configured on weekly charts. Areas of interest lay down to $13.50 and up to $29 as the market decides whether consolidation will continue or an upside breakout transpires. By closely watching response to support/resistance, traders can position themselves ahead of the likely resumption of the large scale trend in the weeks ahead. Overall, the technical evidence continues to favor the prospect of higher prices for LINK USDT over the medium to long run.
Support Levels
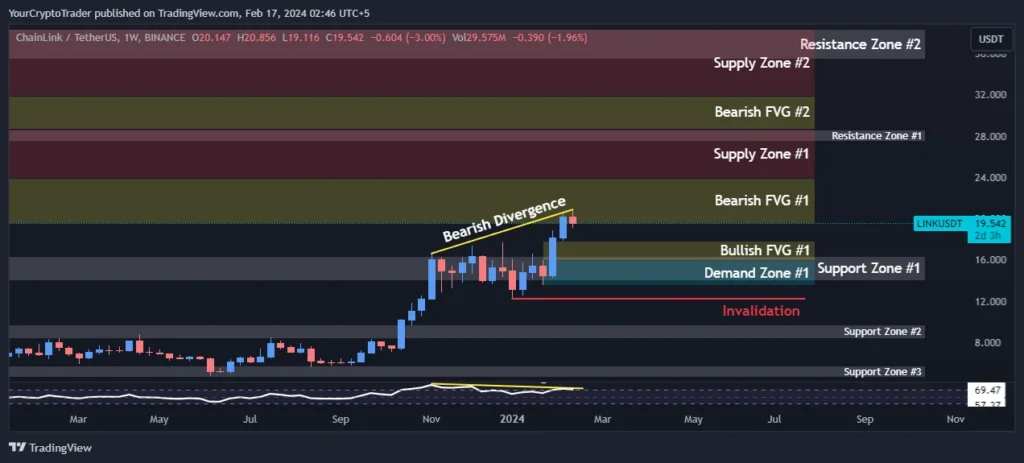
On the support side, there are three distinct levels that LINK will need to hold to maintain an overall bullish structure. The strongest support comes in between $14-16, with the middle zone from $8-10 also significant. Breaking below the third and lowest support zone around $5 could imply a drop towards the yearly low.
| Support Zone Number | Price High | Price Low |
| Support Zone #1 | 14.047 | 16.324 |
| Support Zone #2 | 8.412 | 9.736 |
| Support Zone #3 | 4.617 | 5.778 |
Resistance Levels
On the upside, resistance awaits in the $28-38 range after the current consolidation. Breaking above this supply zone would be a very bullish development and could open the doors to new all-time highs. Additional overhead pressure exists from $26-29 and above $35. For the bulls to regain control, one of these resistance levels will need to give way to allow for higher prices.
| Resistance Zone Number | Price High | Price Low |
| Resistance Zone #1 | 27.533 | 28.629 |
| Resistance Zone #2 | 35.450 | 38.373 |
Fibonacci Retracement Levels
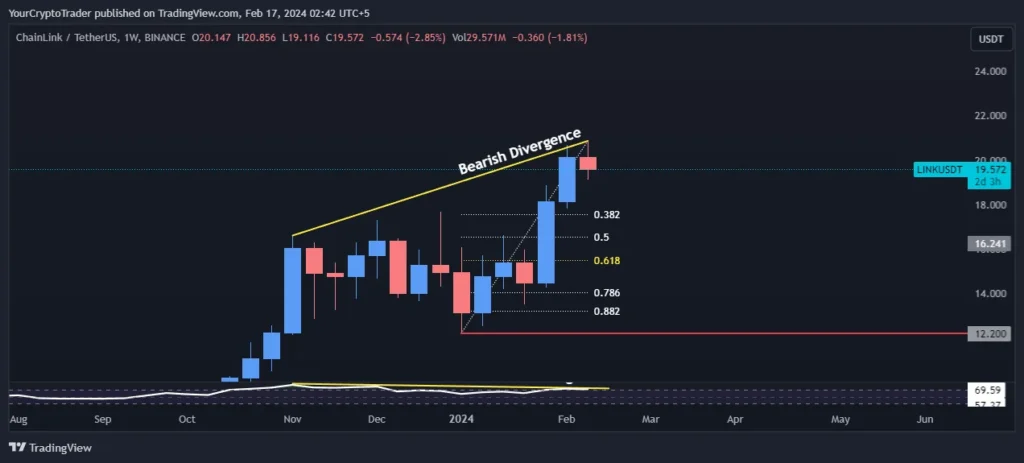
Fibonacci retracements provide helpful reference points for potential pullbacks or continuations of the prevailing trend. The most relevant retracement levels for LINK USDT currently sit at $15.51, $16.53, and $17.54. Holding above these levels would keep the overall structure positive. A violation of the 0.786 level at $14.06 could undermine the bullish thesis. On the upside, regaining the 0.5 level would be an encouraging sign for the resumption of the uptrend.
| Fib Retracement Value | Price |
| 0.382 Fib Level | 17.543 |
| 0.50 Fib Level | 16.530 |
| 0.618 Fib Level | 15.517 |
| 0.786 Fib Level | 14.060 |
| 0.882 Fib Level | 13.216 |
Supply Zones
| Supply Zone Number | Price High | Price Low |
| Supply Zone #1 | 23.910 | 28.710 |
| Supply Zone #2 | 31.900 | 38.310 |
Demand Zones
Looking more closely at the upper timeframes, we can identify some significant demand and supply zones formed by previous price action. On the demand side, the $15-13.5 zone stands out as a major buy-the-dip area. Holding above here on a weekly close would maintain an overall bullish posture.
| Demand Zone Number | Price High | Price Low |
| Demand Zone | 15.974 | 13.506 |
Fair Value Gaps / Imbalances (FVG)
Excess movement between expected fair value levels can indicate areas of imbalance. For LINK, the $18-16 zone represents an undervalued area where buying pressure could emerge on a retest. There are also bearish gaps from $24-20 and $32-29 that may prove resistance if challenged. Breakouts above or below these ranges would provide insight into the market’s interpretation of value.
| FVG Zone Number | Price High | Price Low |
| Bullish FVG #1 | 17.806 | 15.974 |
| Bearish FVG #1 | 23.910 | 19.540 |
| Bearish FVG #2 | 31.900 | 28.710 |
Fixed Range Volume Profile Levels
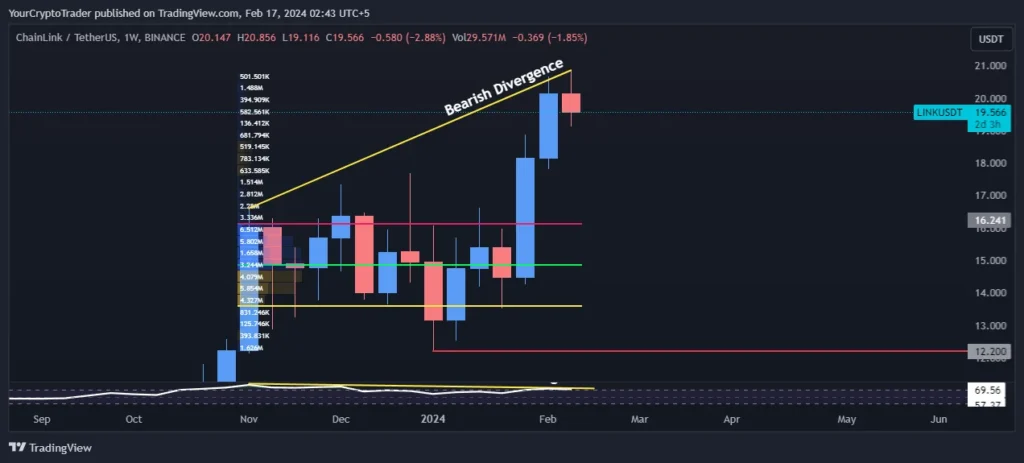
Drilling down into volume, we can identify important value areas derived from prior transactions. The point of control (POC) sits at $14.87, indicating this is the “fair” price according to historical participation. Meanwhile, the value area high (VAH) of $16.14 and value area low (VAL) of $13.61 form a range encompassing most previous volume. Holding above the lower value area would be favored for continued momentum.
| Point of Control (POC) | Value Area High (VAH) | Value Area Low (VAL) |
| 14.871 | 16.137 | 13.605 |
Relative Strength Index (RSI) Levels
The RSI is currently in overbought territory above 70, suggesting short-term overheating. There is also a bearish divergence with price near the $17 level, implying a correction may be well on its way. LINK would need to regain its directional strength to assume an advantageous position. Renewed buying interest to break above resistance could validate a shift to bullish RSI conditions. But for now, slower momentum may prevail.
Current RSI Level: 69.63
Bullish or Bearish Divergences
Bearish Divergence: 16.600
Trade Bias
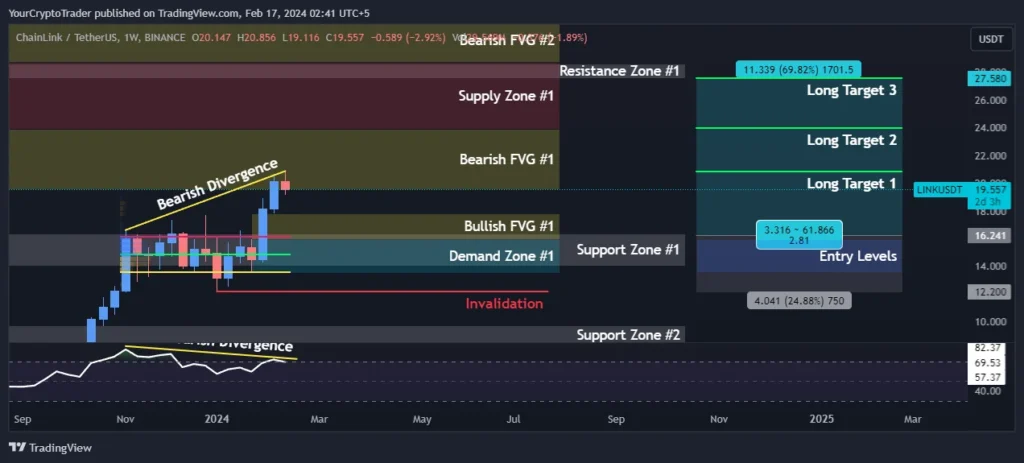
Despite short-term overheating, the presence of strong support in the $14-16 zone and bullish factors on higher timeframes imply an overall long bias remains warranted. Two potential low-risk entry points exist currently. The first sits right at the demand zone low of $16. The second and lower-risk approach would involve waiting for a pullback to the VAL around $13.55 before entering.
In either scenario, a close below $12.20 would invalidate the long case. Otherwise, initial target zones line up with resistance barriers at $21, $24, and $28. Patience and only entering on a dip toward identified support look to offer the best risk/reward setup based on the confluence of indicators outlined above. But further consolidation cannot be ruled out before the next directional move emerges.
Trade Bias: Long
Entry Levels
| Entry Level Zone Number | Entry Level Price |
| Entry Levels 1 | 15.967 |
| Entry Levels 2 | 13.559 |
Invalidation Levels
| Invalidation Type (Long, Short) | Invalidation Price |
| Long | 12.200 |
Target Levels
| Target Level | Target Price |
| Long Target 1 | 20.844 |
| Long Target 2 | 23.945 |
| Long Target 3 | 27.587 |