MATIC USDT is trading within clearly defined 4 hour support and resistance levels while respecting some important demand areas and Fibonacci retracements on the 1 hour chart. As long as support holds on the daily timeframe, a continued neutral to bullish bias remains for Polygon over the medium term.
4 Hour Timeframe
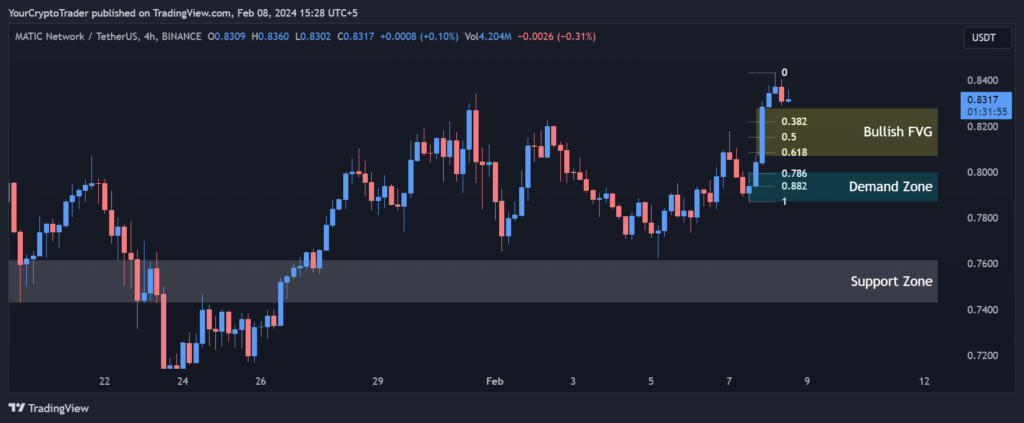
On the 4 hour chart for Polygon, we can see price action trading within the support zone of 0.7429 – 0.7617 and resistance zone of 0.9327 – 0.9515.
Support and Resistance Levels
This has created a defined range where MATIC is currently consolidating. As long as support holds, the near term structure remains neutral to bullish.
| S / R Type | High | Low |
| Support Zone | 0.7429 | 0.7617 |
| Resistance Zone | 0.9327 | 0.9515 |
Fibonacci Retracement Levels
Within the range, important Fibonacci retracement levels may provide clues about potential bounce areas. The 0.382, 0.50 and 0.618 levels at 0.8218, 0.8154 and 0.8086 act as resistance turned support in case of a pullback.
| 0.382 | 0.8218 |
| 0.50 | 0.8154 |
| 0.618 | 0.8086 |
| 0.786 | 0.7992 |
| 0.882 | 0.7937 |
Demand Zone
The demand zone between 0.8000 – 0.7872 could attract buyers on a retest of this area.
| Zone Number | High | Low |
| Demand Zone | 0.8000 | 0.7872 |
Fair Value Gaps / Imbalances
The bullish fair value gap from 0.8070 – 0.8280 signals positive momentum may emerge within this zone in the future.
| Gap Number | High | Low |
| Bullish FVG | 0.8070 | 0.8280 |
1 Hour Timeframe
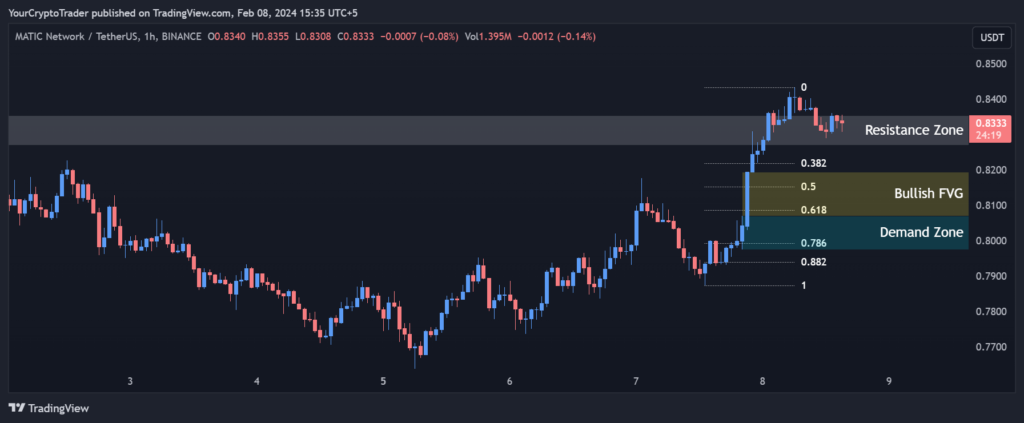
On the 1 hour chart, there is resistance forming at 0.8270 – 0.8354 just above the current price.
Support and Resistance Levels
| S / R Type | High | Low |
| Resistance Zone | 0.8270 | 0.8354 |
Fibonacci Retracement Levels
The same Fibonacci retracement levels are in play as support with levels at 0.8219, 0.8152, 0.8086 and 0.7992.
| 0.382 | 0.8219 |
| 0.50 | 0.8152 |
| 0.618 | 0.8086 |
| 0.786 | 0.7992 |
| 0.882 | 0.7938 |
Demand Zone
Below, the demand zone spanning 0.8070 – 0.7975 may provide an area of buying interest.
| Zone Number | High | Low |
| Demand Zone | 0.8070 | 0.7975 |
Fair Value Gaps / Imbalances
The bullish fair value gap ranging from 0.8194 – 0.8070 could see momentum turn higher on a revisit to this window.
| Gap Number | High | Low |
| Bullish FVG | 0.8194 | 0.8070 |