MATIC USDT is in a consolidation phase on both timeframes based on the technical structures. Near term direction would depend on how it trades relative to the key demand zones, Fibonacci retracement levels and fair value gaps highlighted above. Upside is capped between $0.8270- $0.9515 while downside has initial support at $0.7912 and $0.7792 levels.
4 Hour Timeframe
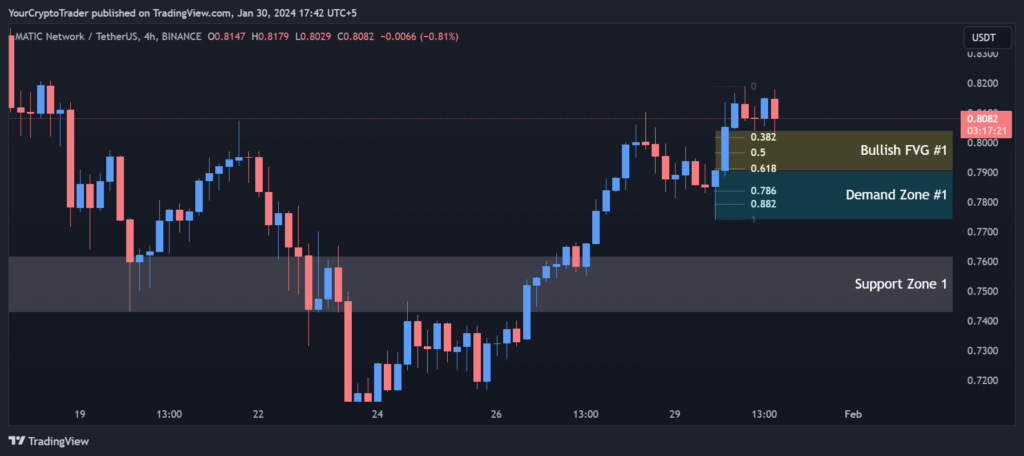
Based on the above factors, the short term trend in the 4-hour timeframe appears to be sideways to negative. Immediate resistance lies at the 4-hour resistance zone 1 of $0.9327-$0.9515. Only a break above this zone would signal the start of a new up move in the next 1-2 days. Until then, downside risks remain with support at $0.7912 and $0.7792 levels.
Support and Resistance Levels
As seen in the support and resistance chart, MATIC USDT is currently trading between the support zone 1 of $0.7429-$0.7617 and resistance zone 1 of $0.9327-$0.9515 in the 4-hour timeframe.
| S / R Type | High | Low |
| Support Zone 1 | 0.7429 | 0.7617 |
| Resistance Zone 1 | 0.9327 | 0.9515 |
Fibonacci Retracement Levels
The Fibonacci retracement levels show that the 38.2% level of $0.8018 and 50% level of $0.7964 have already been breached, indicating the upside momentum is waning. The next support lies at the 61.8% level of $0.7912. A breakdown below this level would imply further downside to the 78.6% level of $0.7835 and the 88.2% level of $0.7792.
| 0.382 | 0.8018 |
| 0.50 | 0.7964 |
| 0.618 | 0.7912 |
| 0.786 | 0.7835 |
| 0.882 | 0.7792 |
Demand Zone
There is a demand zone between $0.7907-$0.7740 which could potentially arrest any decline from current levels.
| Zone Number | High | Low |
| Demand Zone #1 | 0.7907 | 0.7740 |
Fair Value Gaps / Imbalances
A bullish fair value gap exists between $0.7907- $0.8040 which needs to be filled for the short term momentum to turn positive again. The current price is already testing this gap area.
| Gap Number | High | Low |
| Bullish FVG #1 | 0.7907 | 0.8040 |
1 Hour Timeframe
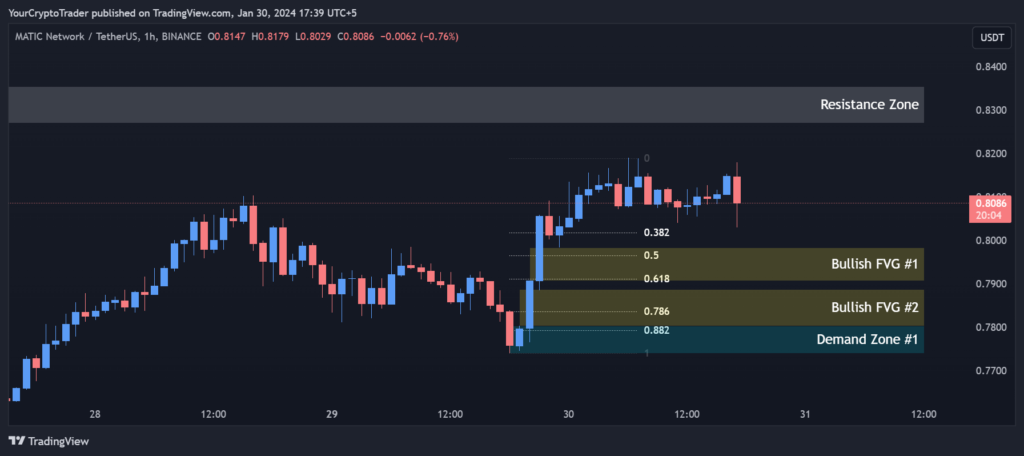
The 1-hour chart also points to a sideways trading range in the very near term with resistance at $0.8270. A break below $0.7912 on the downside or above $0.8270 on the upside would help establish the next short term trend direction.
Support and Resistance Levels
Zooming into the 1-hour chart, we can see MATIC USDT is trading within a narrow range of $0.8270- $0.8354 resistance zone in the short term.
| S / R Type | High | Low |
| Resistance Zone | 0.8270 | 0.8354 |
Fibonacci Retracement Levels
Like in the 4-hour chart, the 1-hour Fibonacci retracement levels of 38.2%, 50%, 61.8% and 78.6% have all been breached, indicating bearish momentum.
| 0.382 | 0.8017 |
| 0.50 | 0.7965 |
| 0.618 | 0.7911 |
| 0.786 | 0.7836 |
| 0.882 | 0.7793 |
Demand Zone
There is a demand zone between $0.7804- $0.7740 providing initial support.
| Zone Number | High | Low |
| Demand Zone #1 | 0.7804 | 0.7740 |
Fair Value Gaps / Imbalances
Two unfilled bullish fair value gaps exist from $0.7907- $0.7984 and $0.7804- $0.7888. Closure of these gaps in the upcoming sessions would aid upside momentum.
| Gap Number | High | Low |
| Bullish FVG #1 | 0.7907 | 0.7984 |
| Bullish FVG #2 | 0.7804 | 0.7888 |