The current price of MATIC USDT is $0.94438. The overall trade bias is long as MATIC shows signs of an upward move.
Based on the confluence of bullish signals across timeframes, the risk-reward favors initiating long positions with above mentioned entry and targets for potential upside in the short term.
Support Levels
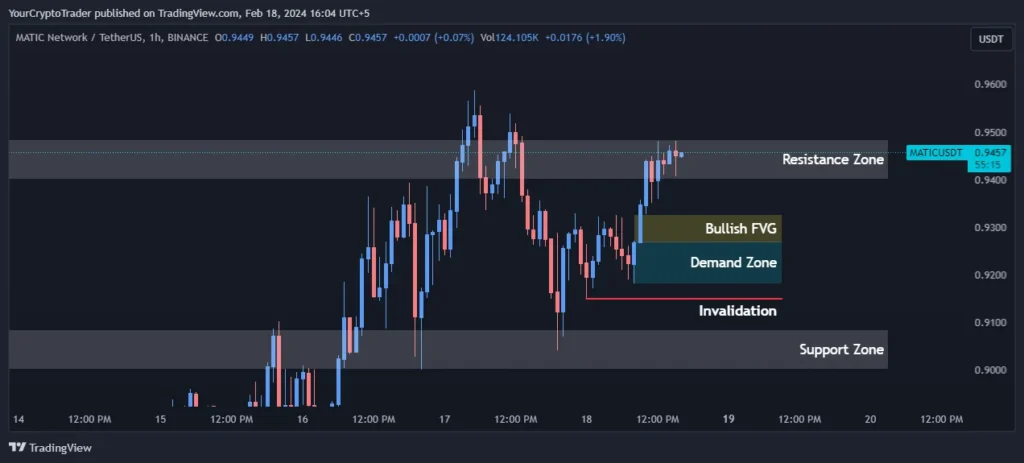
The key support zones are $0.9002-$0.9086 and the demand zone of $0.9272-$0.9181. Breaking below these levels could signal a trend reversal.
| Support Zone Number | Price High | Price Low |
| Support Zone | 0.9002 | 0.9086 |
Resistance Levels
Resistance zones are seen at $0.9402-$0.9485. A break above these levels will confirm the bullish momentum.
| Resistance Zone Number | Price High | Price Low |
| Resistance Zone | 0.9402 | 0.9485 |
Fibonacci Retracement Levels
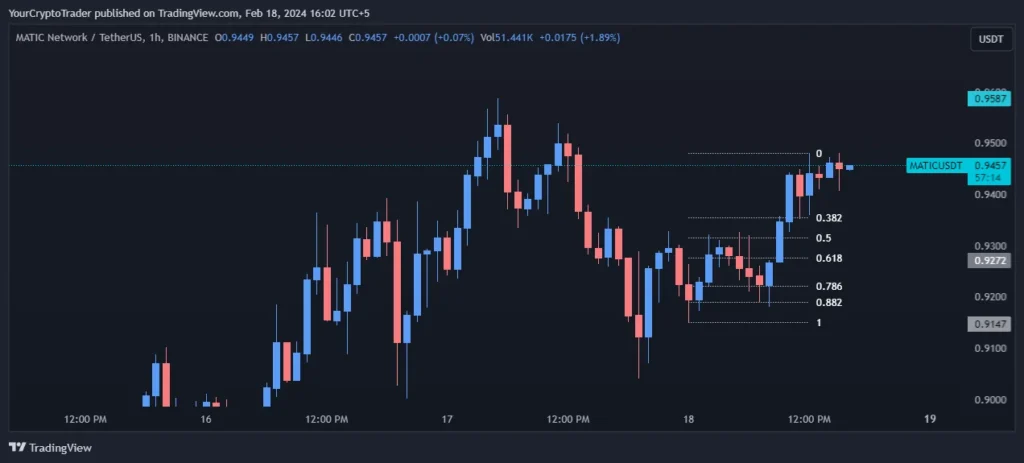
The 0.382, 0.5, 0.618 and 0.786 Fib levels from $0.9354 to $0.9189 will act as support in an uptrend.
| Fib Retracement Value | Price |
| 0.382 Fib Level | 0.9354 |
| 0.50 Fib Level | 0.9315 |
| 0.618 Fib Level | 0.9276 |
| 0.786 Fib Level | 0.9220 |
| 0.882 Fib Level | 0.9189 |
Demand Zones
Strong demand is observed in the $0.9272-$0.9181 zone which makes it a good entry area.
| Demand Zone Number | Price High | Price Low |
| Demand Zone | 0.9272 | 0.9181 |
Fair Value Gaps / Imbalances (FVG)
The bullish FVG between $0.9327-$0.9267 adds to the upside bias.
| FVG Zone Number | Price High | Price Low |
| Bullish FVG | 0.9327 | 0.9267 |
Exponential Moving Averages (EMA) Levels
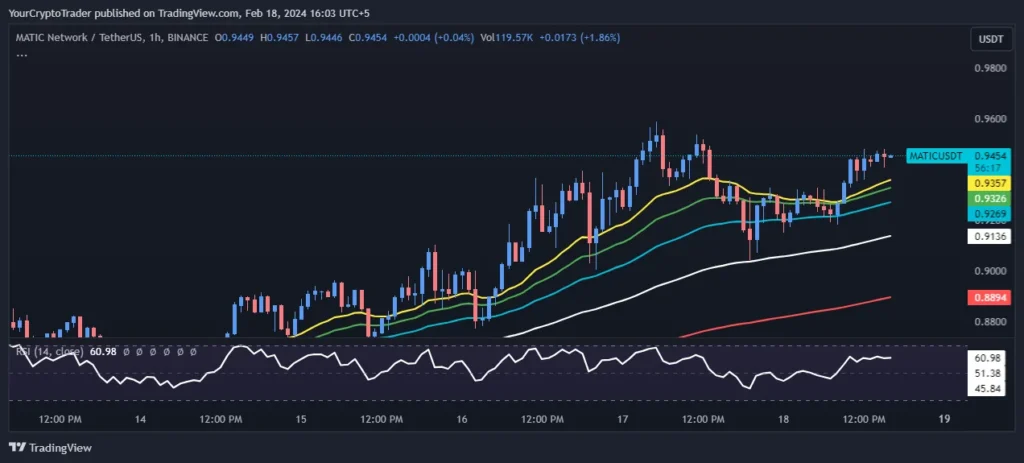
Price is well above the 21,34,55 EMAs showing strength. A pullback to the 100 EMA at $0.9123 can be used as an additional entry opportunity.
| EMA Type | EMA Price on Chart |
| 200 EMA (Red Color) | 0.8888 |
| 100 EMA (White Color) | 0.9123 |
| 55 EMA (Blue Color) | 0.9267 |
| 34 EMA (Green Color) | 0.9316 |
| 21 EMA (Yellow Color) | 0.9345 |
Fixed Range Volume Profile Levels
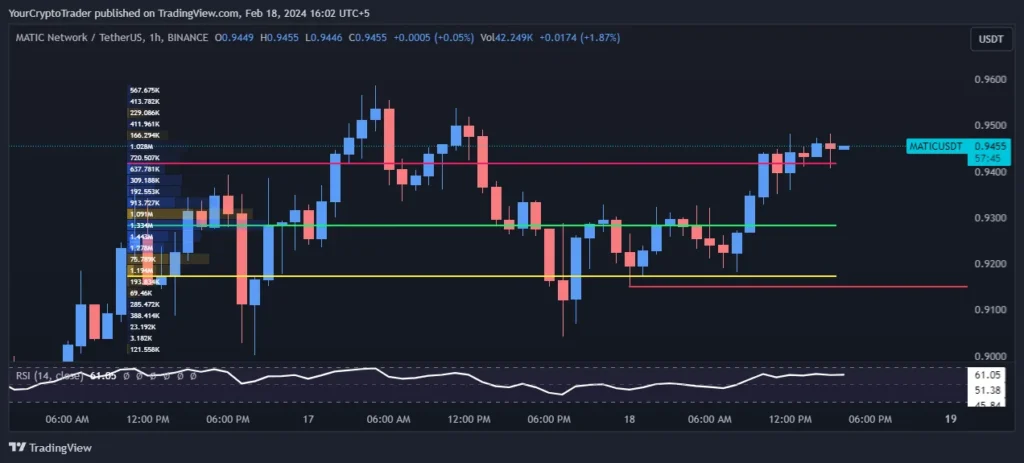
The Point of Control at $0.9283 and Value Area High at $0.9416 line up with resistance levels
| Point of Control (POC) | Value Area High (VAH) | Value Area Low (VAL) |
| 0.9283 | 0.9416 | 0.9173 |
Relative Strength Index (RSI) Levels
Not in an overbought territory suggests room for upward momentum to continue.
Current RSI Level: 56.85
Trade Bias
Trade Bias: Long
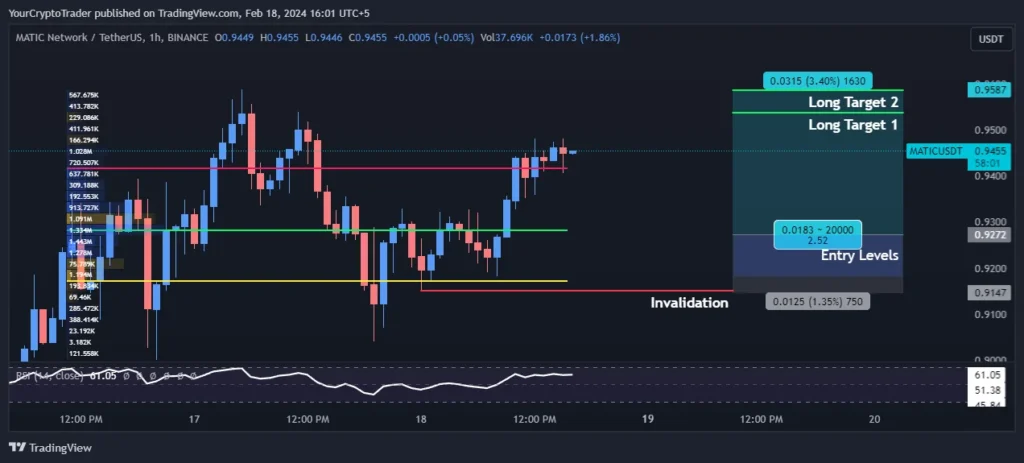
Entry Levels
Entry can be considered in the demand zone of $0.9272 or pullback to $0.9182 support.
| Entry Level Zone Number | Entry Level Price |
| Entry Levels 1 | 0.9272 |
| Entry Levels 2 | 0.9182 |
Invalidation Levels
Close below $0.9150 will negate the long bias.
| Invalidation Type (Long, Short) | Invalidation Price |
| Long | 0.9150 |
Target Levels
Immediate target is seen at $0.9537 fib level. Clearing this opens up moves to $0.9586 long target.
| Target Level | Target Price |
| Long Target 1 | 0.9537 |
| Long Target 2 | 0.9586 |