The current price of MATIC USDT is $0.9495. The overall trade bias is long as MATIC looks poised to continue its upward trend.
Based on the confluence of bullish factors across timeframes and indicators, the overall bias remains long with targets towards $0.9655. Manage risk around key support levels.
Support Levels
Strong support lies between $0.7429-$0.7617. Break below this zone would shift the bias bearish.
| Support Zone Number | Price High | Price Low |
| Support Zone | 0.7429 | 0.7617 |
Resistance Levels
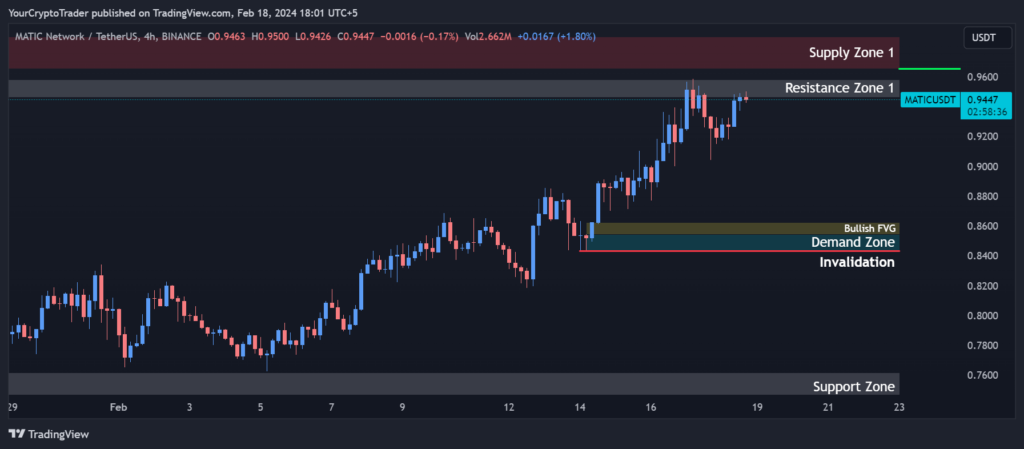
Immediate resistance is between $0.9465-$0.9582. A break above this zone could see prices test higher resistance at $0.9655-$0.9868.
| Resistance Zone Number | Price High | Price Low |
| Resistance Zone | 0.9465 | 0.9582 |
Fibonacci Retracement Levels
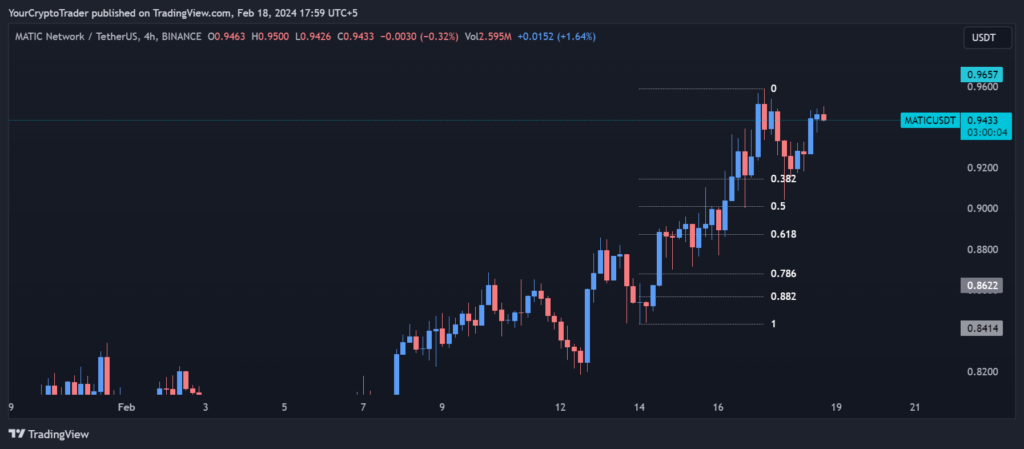
The 0.382, 0.50, 0.618 and 0.786 Fib retracement levels from the recent swing high/low provide support at $0.9148, $0.9010, $0.8878 and $0.8679 respectively.
| Fib Retracement Value | Price |
| 0.382 Fib Level | 0.9148 |
| 0.50 Fib Level | 0.9010 |
| 0.618 Fib Level | 0.8878 |
| 0.786 Fib Level | 0.8679 |
| 0.882 Fib Level | 0.8622 |
Supply Zones
| Supply Zone Number | Price High | Price Low |
| Supply Zone | 0.9655 | 0.9868 |
Demand Zones
Buying pressure may pick up around $0.8544-$0.8438 demand zone. This overlaps with the bullish FVG zone $0.8544-$0.8624.
| Demand Zone Number | Price High | Price Low |
| Demand Zone | 0.8544 | 0.8438 |
Fair Value Gaps / Imbalances (FVG)
| FVG Zone Number | Price High | Price Low |
| Bullish FVG | 0.8544 | 0.8624 |
Exponential Moving Averages (EMA) Levels
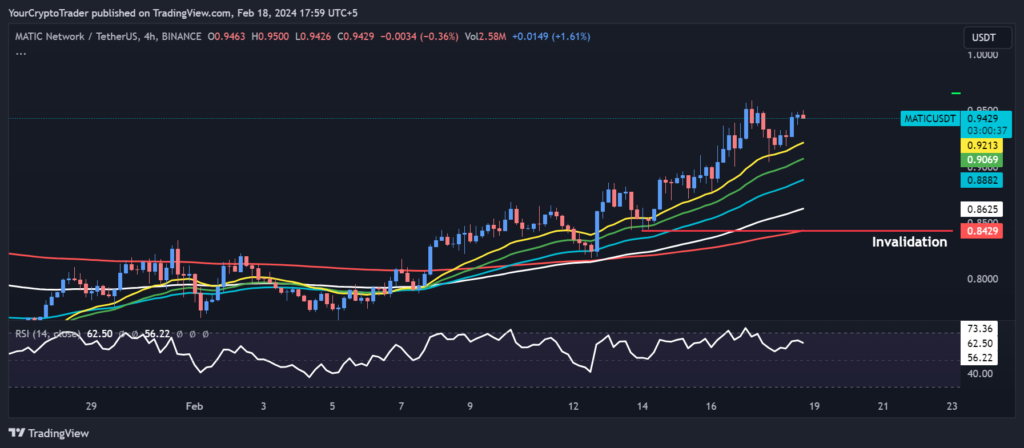
Uptrend intact as price trades above the EMAs. Bullish crossover of shorter EMAs above longer ones.
| EMA Type | EMA Price on Chart |
| 200 EMA (Red Color) | 0.8429 |
| 100 EMA (White Color) | 0.8626 |
| 55 EMA (Blue Color) | 0.8883 |
| 34 EMA (Green Color) | 0.9071 |
| 21 EMA (Yellow Color) | 0.9216 |
Fixed Range Volume Profile Levels

Majority of volume concentrated between $0.7583-$0.9092 (VAL-VAH). POC at $0.8518 adds support.
| Point of Control (POC) | Value Area High (VAH) | Value Area Low (VAL) |
| 0.8518 | 0.9092 | 0.7583 |
Relative Strength Index (RSI) Levels
Not overbought at 63.52, room for further upside.
Current RSI Level: 63.52
Trade Bias
Trade Bias: Long
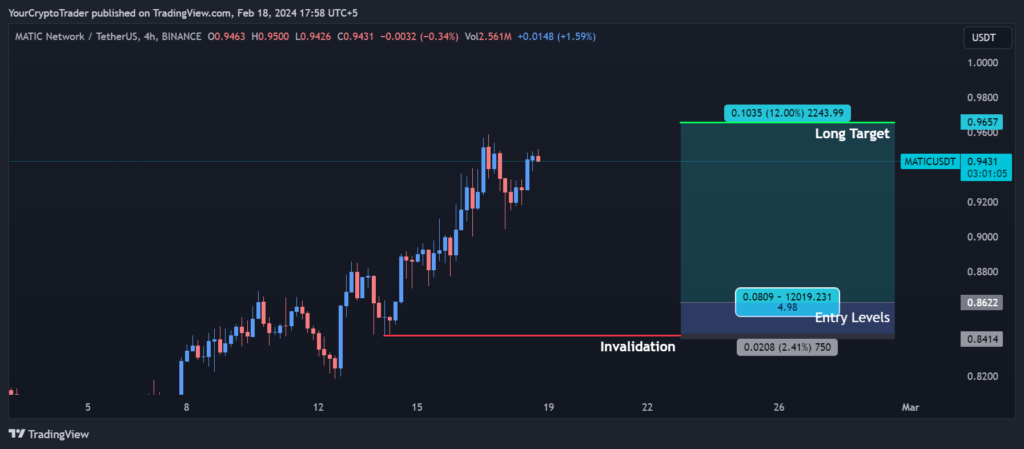
Entry Levels
Entries can be placed at $0.8622 and $0.8443 support zones.
| Entry Level Zone Number | Entry Level Price |
| Entry Levels 1 | 0.8622 |
| Entry Levels 2 | 0.8443 |
Invalidation Levels
Long positions can be exited if price closes below $0.8432 invalidating the bullish structure.
| Invalidation Type (Long, Short) | Invalidation Price |
| Long | 0.8432 |
Target Levels
Initial target is supply zone between $0.9655-$0.9868. Strong bullish case above this level.
| Target Level | Target Price |
| Long Target | 0.9655 |