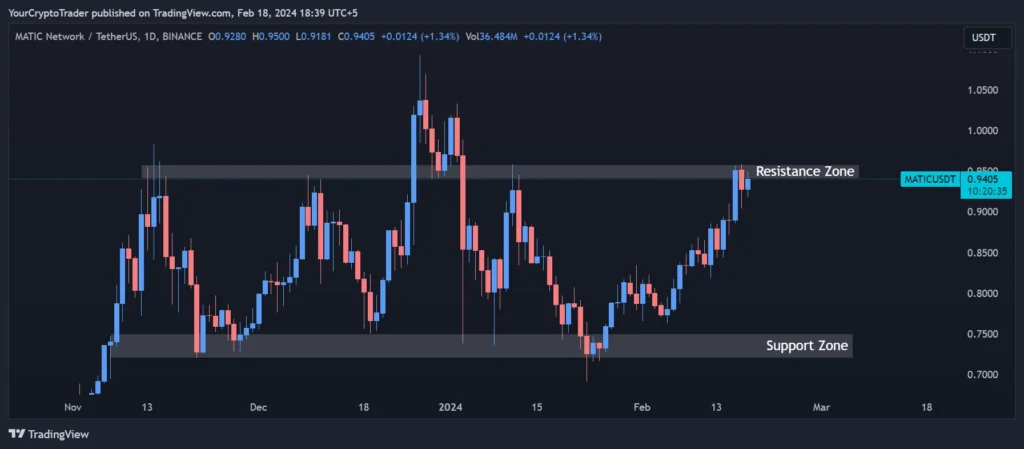
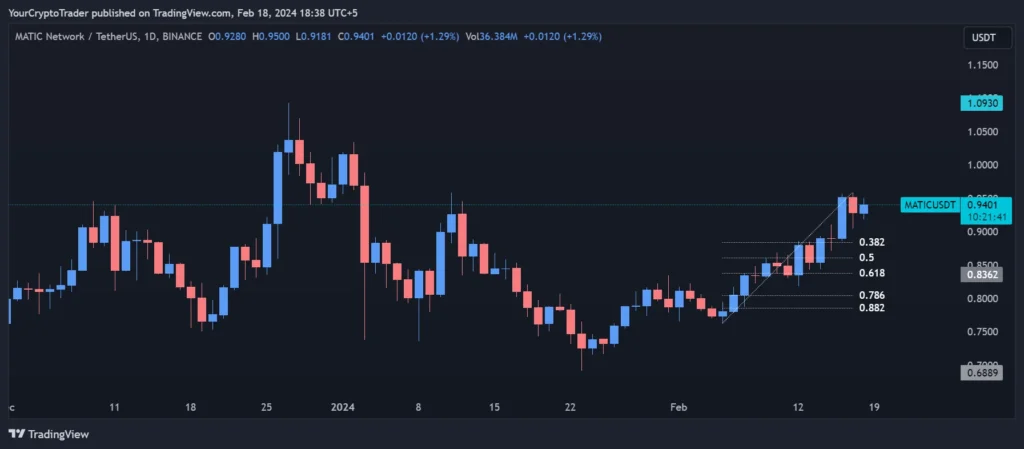
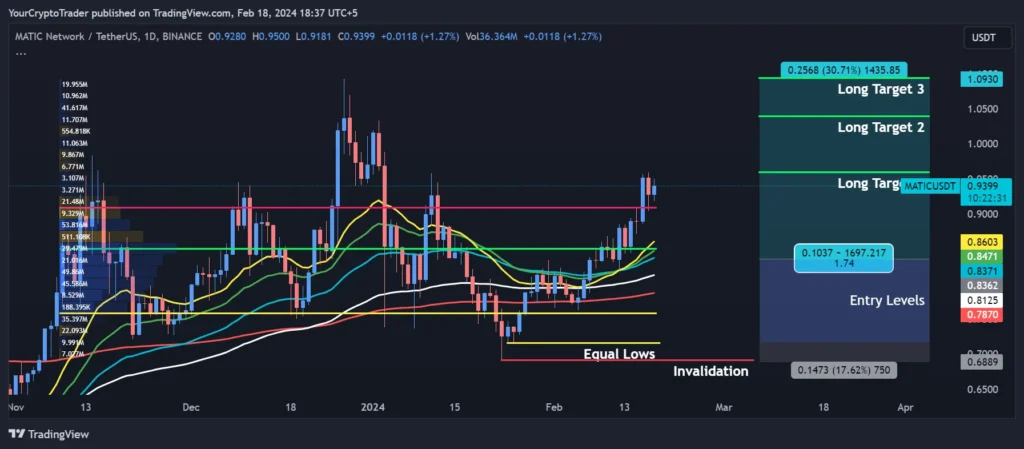
The current price of MATIC USDT is trading within a resistance zone between $0.9410- $0.9582. It faces resistance in this zone. Above this, the next resistance levels are the 0.382, 0.50, and 0.618 Fibonacci retracement levels at $0.8839, $0.8611, and $0.8377 respectively.
The technical analysis points to further upside potential for MATIC USDT if it breaks above the $0.9410- $0.9582 resistance zone. Traders can look to enter long positions on dips with targets as indicated.
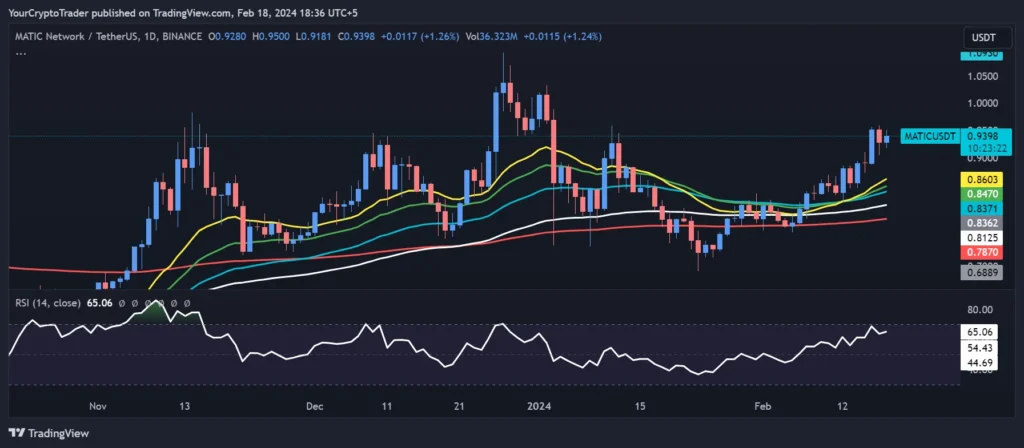
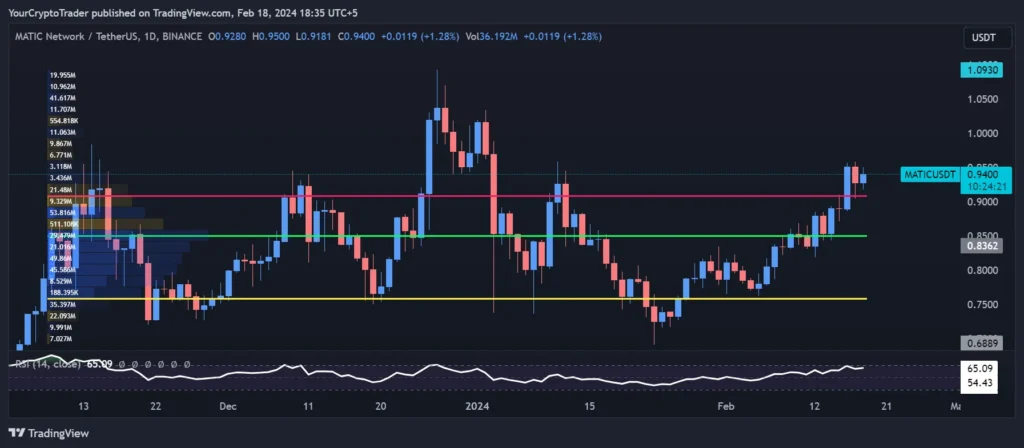
MATIC finds strong support at the $0.7206- $0.7505 support zone. Below this, additional support exists at the Equal Lows liquidity level of $0.7159 and the 200 EMA (red) at $0.7870. The 21 EMA (yellow), 34 EMA (green), 55 EMA (blue), 100 EMA (white) provide horizontal support near $0.8605, $0.8472, $0.8371, and $0.8125 respectively. The value area low (VAL) of the fixed range volume profile offers support at $0.7581.
Support Levels
Support Zone Number
Price High
Price Low
Support Zone
0.7206
0.7505
Resistance Levels
Resistance Zone Number
Price High
Price Low
Resistance Zone
0.9410
0.9582
Fibonacci Retracement Levels
Fib Retracement Value
Price
0.382 Fib Level
0.8839
0.50 Fib Level
0.8611
0.618 Fib Level
0.8377
0.786 Fib Level
0.8044
0.882 Fib Level
0.7856
Exponential Moving Averages (EMA) Levels
EMA Type
EMA Price on Chart
200 EMA (Red Color)
0.7870
100 EMA (White Color)
0.8125
55 EMA (Blue Color)
0.8371
34 EMA (Green Color)
0.8472
21 EMA (Yellow Color)
0.8605
Liquidity Levels
Liquidity Type (Double Top, Double Bottom, Equal Lows, Equal Highs)
Price
Equal Lows
0.7159
Fixed Range Volume Profile Levels
Point of Control (POC)
Value Area High (VAH)
Value Area Low (VAL)
0.8504
0.9098
0.7581
Relative Strength Index (RSI) Levels
The relative strength index (RSI) is currently at 65.54 above the midpoint of 50, indicating the bulls have marginally higher momentum. However, there are no bullish or bearish divergences forming.
Current RSI Level: 65.54
Trade Bias
The trade bias is long given the support levels and moving averages are holding well. Key entry levels for long positions are at $0.8361 and $0.7169. The invalidation level for long trades is $0.6913.
Trade Bias: Long
Entry Levels
Entry Level Zone Number
Entry Level Price
Entry Levels 1
0.8361
Entry Levels 2
0.7169
Invalidation Levels
Invalidation Type (Long, Short)
Invalidation Price
Long
0.6913
Target Levels
Targets for the long trade setup are at the resistance zone high of $0.9597, followed by $1.0397, and finally $1.0940.