MATIC USDT faces near-term resistance but maintains an underlying bullish structure. Pullbacks into demand zones could offer shorting opportunities.
The current price of MATIC USDT is 0.9661. Looking at the various technical indicators, here is my analysis:
Support Levels
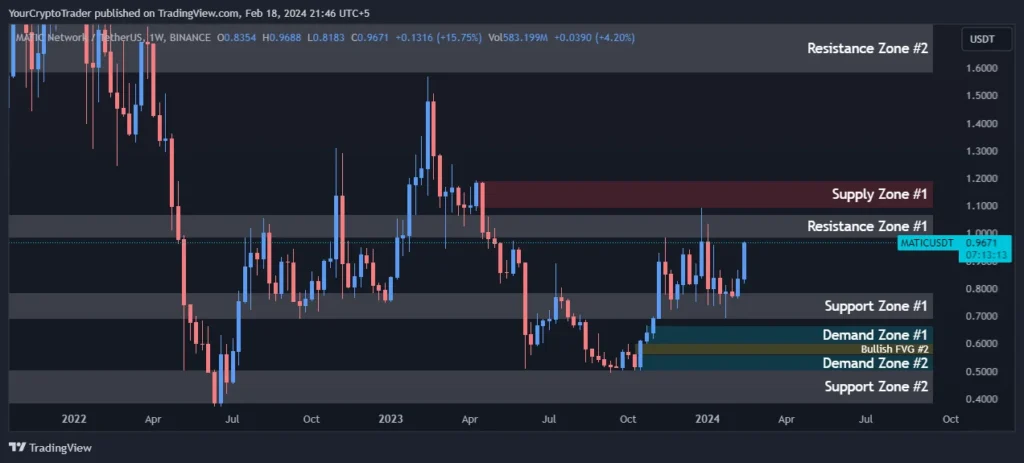
MATIC finds strong support between 0.6901-0.7848 and 0.5044-0.3831. A break below these levels could see further downside.
| Support Zone Number | Price High | Price Low |
| Support Zone #1 | 0.6901 | 0.7848 |
| Support Zone #2 | 0.5044 | 0.3831 |
Resistance Levels
Immediate resistance lies between 0.9831-1.0701. Beyond that, resistance is found at 1.5814-1.7597 and 2.7000-2.8938. Breakouts above these levels will signal more upside.
| Resistance Zone Number | Price High | Price Low |
| Resistance Zone #1 | 0.9831 | 1.0701 |
| Resistance Zone #2 | 1.5814 | 1.7597 |
| Resistance Zone #3 | 2.7000 | 2.8938 |
Fibonacci Retracement Levels
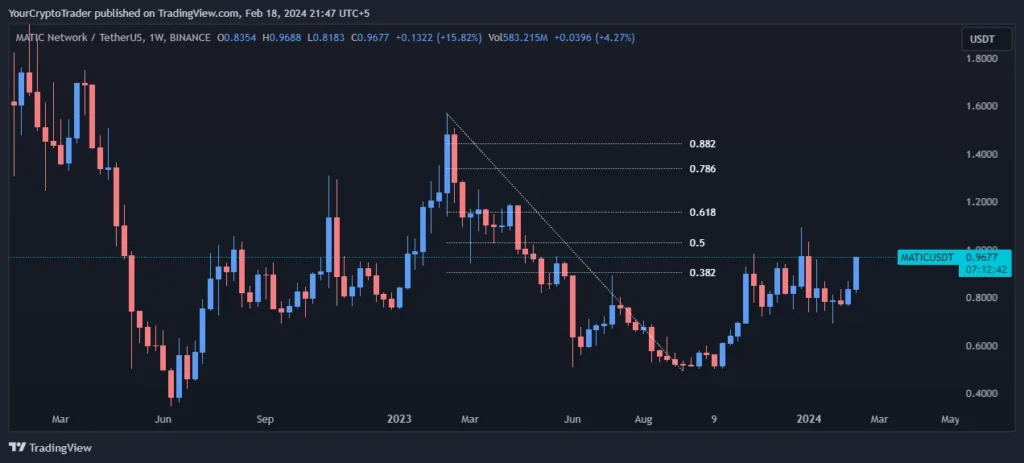
Retracement levels of note are the 0.382 Fib level at 0.9038 and the 0.50 Fib level at 1.0307. A break above these levels suggests the uptrend is intact. The 0.618 level at 1.1561 further strengthens the bull case.
| Fib Retracement Value | Price |
| 0.382 Fib Level | 0.9038 |
| 0.50 Fib Level | 1.0307 |
| 0.618 Fib Level | 1.1561 |
| 0.786 Fib Level | 1.3377 |
| 0.882 Fib Level | 1.4413 |
Supply Zones
Supply is seen at 1.0930-1.1900 which may cap upside moves.
| Supply Zone Number | Price High | Price Low |
| Supply Zone #1 | 1.0930 | 1.1900 |
Demand Zones
Strong demand exists between 0.6651-0.5994 which could halt any declines. Demand is also found at 0.5608-0.5006.
| Demand Zone Number | Price High | Price Low |
| Demand Zone #1 | 0.6651 | 0.5994 |
| Demand Zone #2 | 0.5608 | 0.5006 |
Fair Value Gaps / Imbalances (FVG)
The bullish gap between 0.5608-0.6010 signals buying pressure and an imbalance that could lift prices higher.
| FVG Zone Number | Price High | Price Low |
| Bullish FVG | 0.5608 | 0.6010 |
Exponential Moving Averages (EMA) Levels
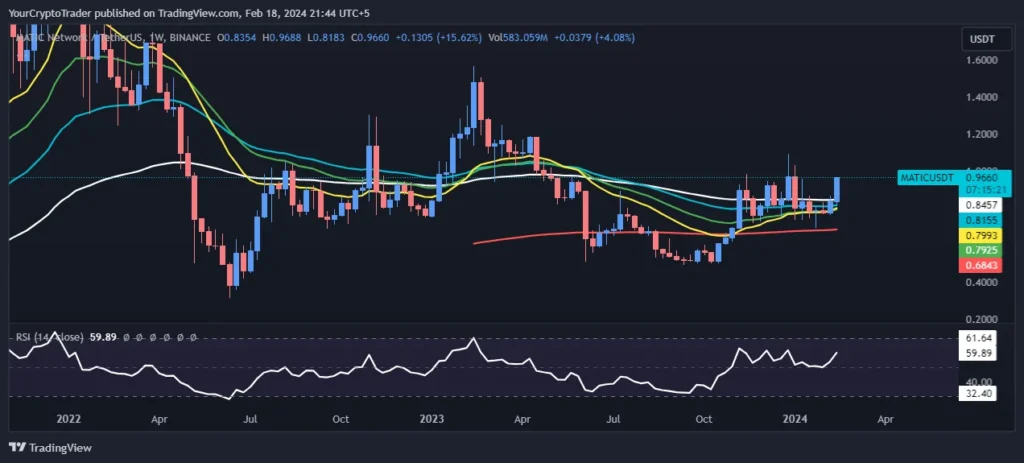
Price is holding above the 21, 34, 55 EMAs which is bullish. Watch for potential resistance at the 100 and 200 EMAs.
| EMA Type | EMA Price on Chart |
| 200 EMA (Red Color) | 0.6842 |
| 100 EMA (White Color) | 0.8455 |
| 55 EMA (Blue Color) | 0.8151 |
| 34 EMA (Green Color) | 0.7920 |
| 21 EMA (Yellow Color) | 0.7986 |
Fixed Range Volume Profile Levels
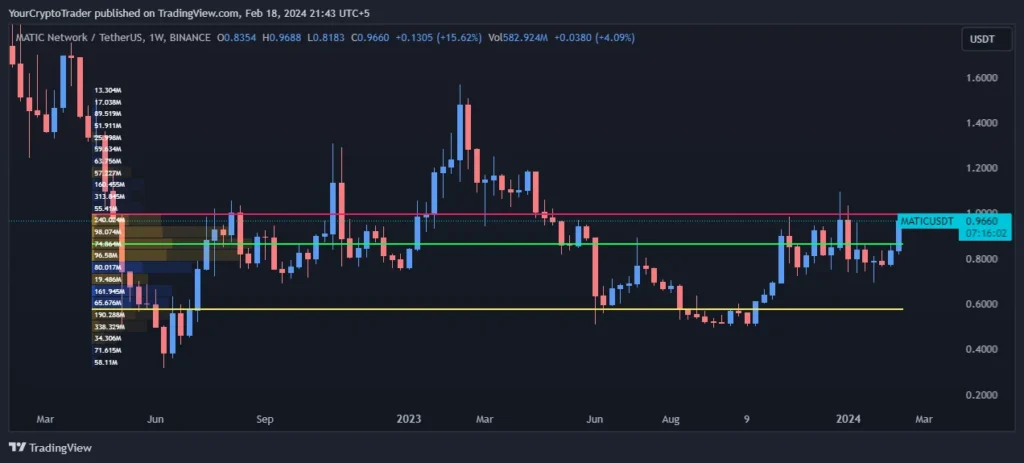
The POC at 0.8650 and VAL at 0.5807 show areas of interest.
| Point of Control (POC) | Value Area High (VAH) | Value Area Low (VAL) |
| 0.8650 | 0.9964 | 0.5807 |
Relative Strength Index (RSI) Levels
Currently at 60.17 indicating neither overbought or oversold.
Current RSI Level: 60.17
Trade Bias
The overall indicators point to a short-term short bias with targets at 0.6932 and 0.5028 on any pullback in the coming weeks.
Trade Bias: Short
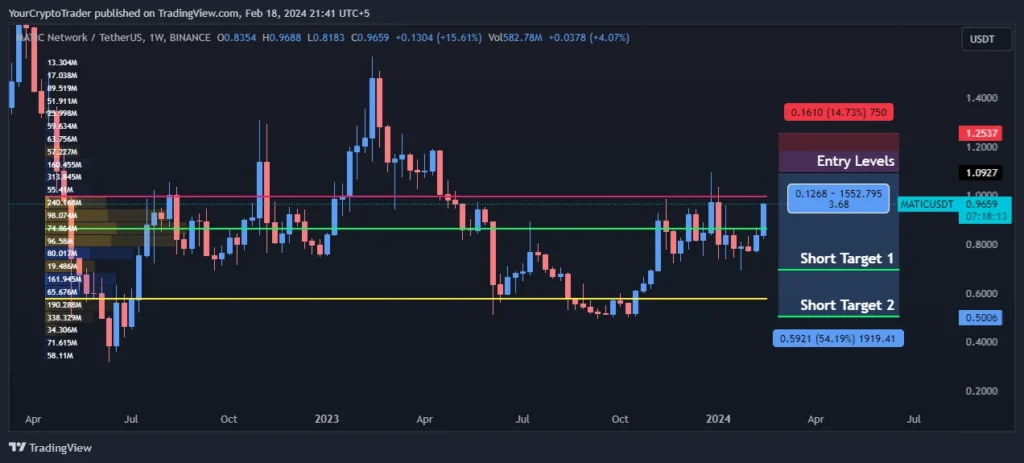
Entry Levels
| Entry Level Zone Number | Entry Level Price |
| Entry Levels 1 | 1.0927 |
| Entry Levels 2 | 1.1868 |
Target Levels
| Target Level | Target Price |
| Short Target 1 | 0.6932 |
| Short Target 2 | 0.5028 |