Optimism OP USDT exhibits signs of accumulation on both the 4-hour and 1-hour timeframes. Bullish fair value gaps, demand zones, and Fibonacci retracement levels provide definitions of support. A break above $3.418 could see the crypto begin a new uptrend targeting resistance at $3.911-$3.996. The technical backdrop augurs well for those looking to take a long position.
The 1-hour timeframes depict Optimism OP USDT gaining short-term momentum following the bounce off key demand. Indicators signal further upside is possible on a break above $3.134. Downside support lies between $2.996-$3.077. As long as this zone holds on temporary dips, the medium-term technical outlook remains constructive.
4 Hour Timeframe
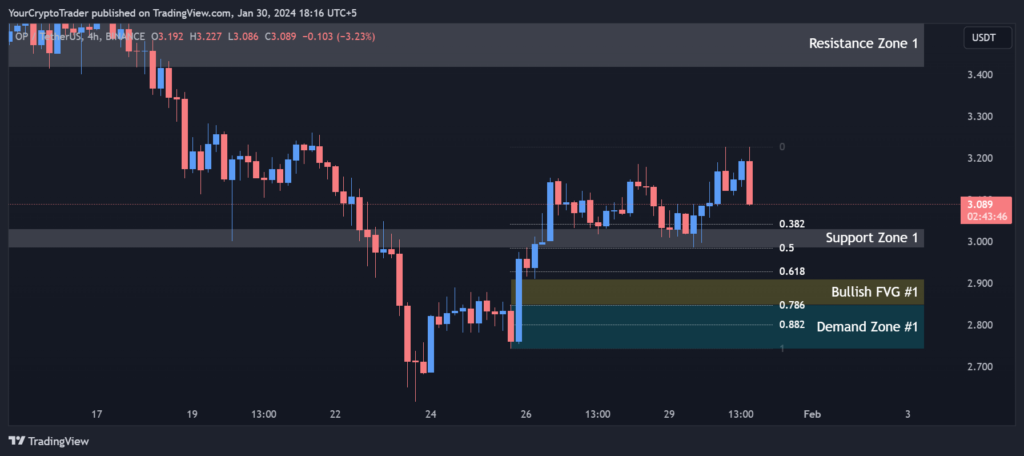
Optimism OP USDT has been trading in a range between the support zone of $2.985-$3.031 and the first resistance zone of $3.418-$3.530 over the past few weeks on the 4-hour timeframe. Price action indicates the cryptocurrency is currently in an accumulation phase with higher lows being formed.
The 0.382, 0.50 and 0.618 Fibonacci retracement levels from the most recent swing high to low provide definitions of support between $3.042 and $2.928. A break below the 0.618 Fib level at $2.928 could see price push down to retest the demand zone #1 between $2.848-$2.743. However, RSI and MACD indicators remain neutral and have yet to give bearish divergences, adding credence to further upside from current levels.
The bullish fair value gap between $2.848-$2.910 also represents an area of interest, as price revisiting this zone could see buyers step in and absorb any selling pressure. If demand is sufficient, it could form the launchpad for a test of the upper resistance zone at $3.418-$3.530. A break above here would expose the next resistance level at $3.911-$3.996.
On the whole, the 4-hour charts depict Optimism OP USDT in an accumulation phase, with intermittent waves of buying and selling pressure keeping the price range bound for now. Indicators suggest further upside is possible on a break above the current upper resistance zone. Key support zones between $2.928-$3.031 will need to hold on any temporary pullbacks facing the bulls.
Support and Resistance Levels
| S / R Type | High | Low |
| Support Zone 1 | 2.985 | 3.031 |
| Resistance Zone 1 | 3.418 | 3.530 |
| Resistance Zone 2 | 3.911 | 3.996 |
Fibonacci Retracement Levels
| 0.382 | 3.042 |
| 0.50 | 2.985 |
| 0.618 | 2.928 |
| 0.786 | 2.847 |
| 0.882 | 2.800 |
Demand Zone
| Zone Number | High | Low |
| Demand Zone #1 | 2.848 | 2.743 |
Fair Value Gaps / Imbalances
| Gap Number | High | Low |
| Bullish FVG #1 | 2.848 | 2.910 |
1 Hour Timeframe
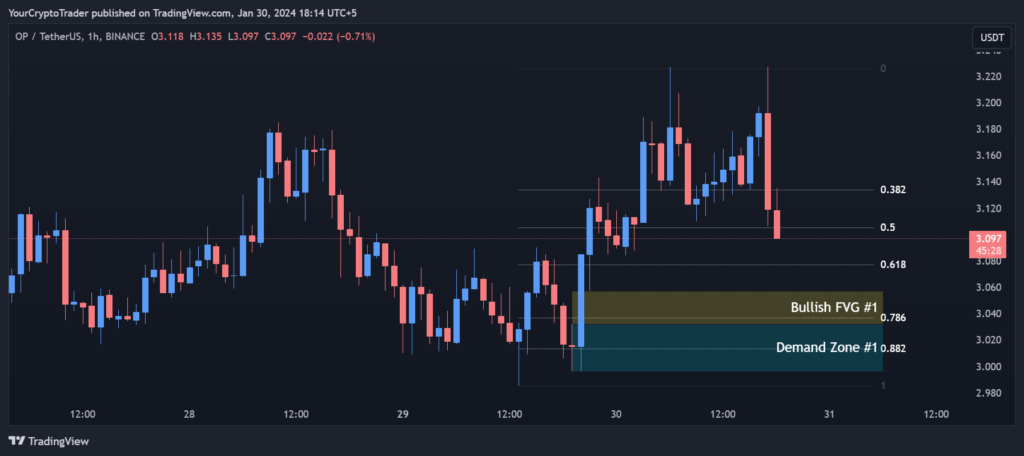
Zooming into the 1-hour charts, we can gain a clearer picture of Optimism’s short-term momentum and structure. Price currently hovers just above the 0.50 Fibonacci level of $3.105, having bounced nicely off the demand zone between $3.032-$2.996 yesterday. This zone corresponds with the bullish fair value gap identified, indicating an area where buyers were willing to absorb sell-side liquidity.
RSI on the 1-hour has rejected a test of the midpoint level, showing buyers are defending the current price level. MACD also remains neutral with no bearish crossover signal in sight. The next upside target would be a breach of the 0.382 Fib level at $3.134, opening the door to a retest of resistance at $3.418. However, with RSI not yet overbought, upside still appears accessible.
On the downside, only a sustained break below demand zone support at $2.996 would raise short-term bearish concerns. This could see the price slide back to the 0.618 Fib level for support around $3.077. As long as this level holds, the broader positive structure will remain intact.
Fibonacci Retracement Levels
| 0.382 | 3.134 |
| 0.50 | 3.105 |
| 0.618 | 3.077 |
| 0.786 | 3.037 |
| 0.882 | 3.014 |
Demand Zone
| Zone Number | High | Low |
| Demand Zone #1 | 3.032 | 2.996 |
Fair Value Gaps / Imbalances
| Gap Number | High | Low |
| Bullish FVG #1 | 3.032 | 3.057 |