The daily price chart of OP USDT shows the crypto coin currently trading in a wide range without a clearly defined trend. Let’s break down the key technical levels that traders are watching.
Overtly bullish short-term signals persist above $3.254 for OP USDT. Pullbacks near the demand zones represent low-risk opportunities for entries on the long side. Strong support holds between support zones 1 and 2.
Support Levels
OP USDT has established two main support zones based on recent price action:
- Support Zone 1 – Between $2.833 and $3.126. This zone encompasses the cluster of lows formed in late December. As long as OP USDT remains above this area, the short-term uptrend will likely remain intact.
- Support Zone 2 – Between $1.809 and $2.063. This lower support zone served as resistance turned support during the December rally. A break below this level could suggest the start of a new downtrend.
| Support Zone Number | Price High | Price Low |
| Support Zone 1 | 2.833 | 3.126 |
| Support Zone 2 | 1.809 | 2.063 |
Fibonacci Retracement Levels
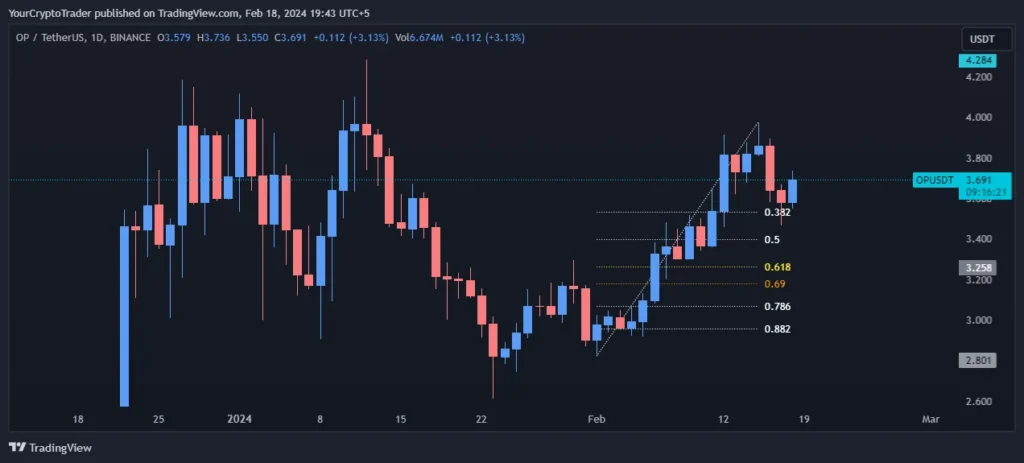
The major resistance levels are projected using Fibonacci retracement extensions on the recent move higher from the December low to the current high:
| Fib Retracement Value | Price |
| 0.382 Fib Level | 3.531 |
| 0.50 Fib Level | 3.399 |
| 0.618 Fib Level | 3.261 |
| 0.786 Fib Level | 3.068 |
| 0.882 Fib Level | 2.957 |
Traders will be watching to see if selling pressure increases at any of these Fibonacci resistance levels. A failure to break above could lead to another round of range-bound trading in the near-term.
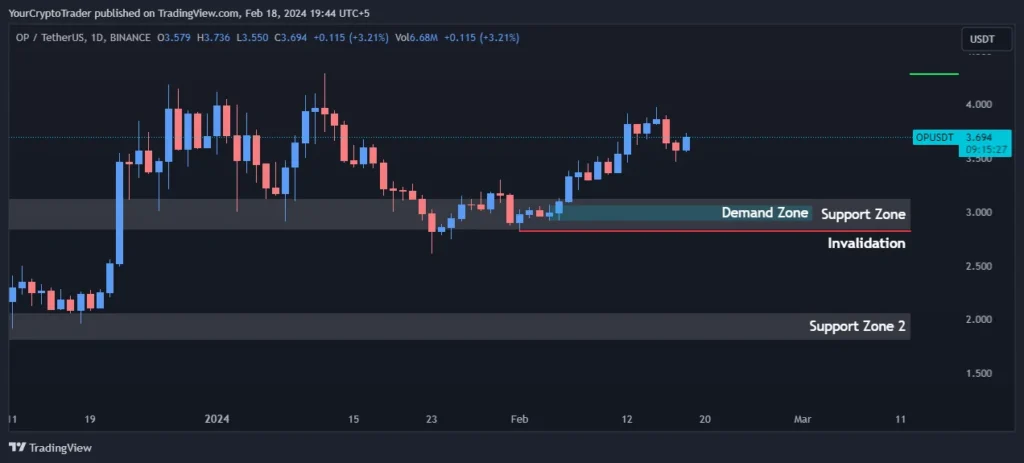
Demand Zones
The demand zone gives insight into price areas that previously acted as resistance but were broken to provide support. Currently, OP USDT is finding support within the demand zone between $3.064-$2.920. As long as this area holds as support, it bodes well for the continuation of the short-term uptrend.
| Demand Zone Number | Price High | Price Low |
| Demand Zone | 3.064 | 2.920 |
Exponential Moving Averages (EMA) Levels
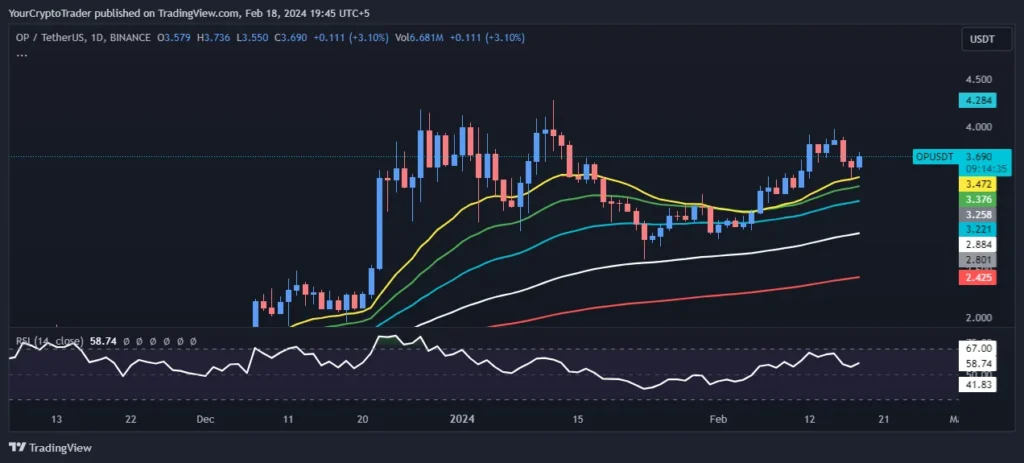
The exponential moving averages (EMA) can help determine the overall trend and identify potential areas of interest. Here are the key EMA levels:
- 200 EMA – $2.425. Below this longer-term average signals the potential for a downward trend.
- 100 EMA – $2.884. This level has provided recent resistance, its break could spark further buying pressure.
- 55 EMA – $3.221. Currently providing dynamic support for the near-term trend.
- 34 EMA – $3.376. Has become supportive in the past two weeks.
- 21 EMA – $3.471. Recently turned from resistance to support, maintaining its uptrend.
| EMA Type | EMA Price on Chart |
| 200 EMA (Red Color) | 2.425 |
| 100 EMA (White Color) | 2.884 |
| 55 EMA (Blue Color) | 3.221 |
| 34 EMA (Green Color) | 3.376 |
| 21 EMA (Yellow Color) | 3.471 |
As long as OP USDT remains above the 21, 34, and 55 EMAs, traders will remain optimistic about the price action in the short-term. However, a daily close below the 100 EMA could stir some concern.
Fixed Range Volume Profile Levels
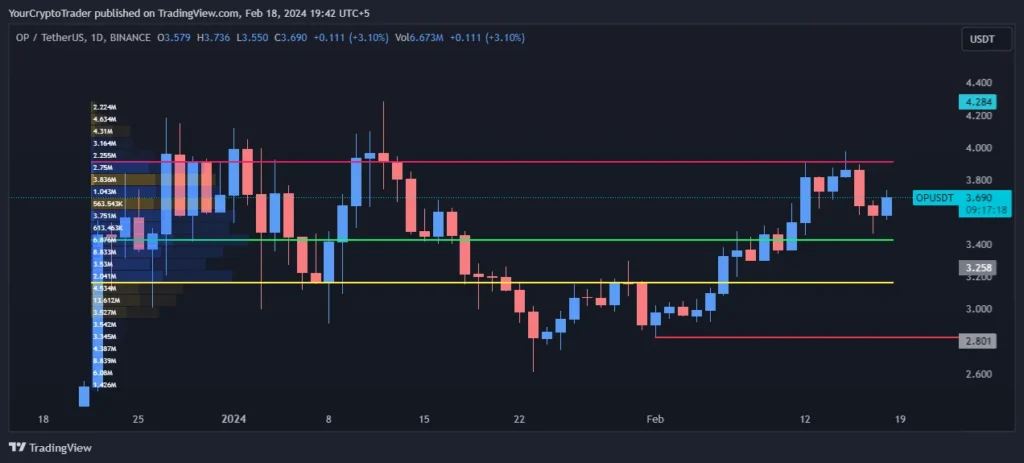
Analyzing the volume profile provides areas of strong concentration of volume. The key levels based on the daily volume profile are:
- POC (Point of Control) – $3.430. This is the price with the highest volume traded, signifying an important support/resistance level.
- VAH (Value Area High) – $3.917. The upper boundary of the high volume node where sellers are less likely to step in.
- VAL (Value Area Low) – $3.161. The lower boundary signifying a potential demand zone based on volume.
| Point of Control (POC) | Value Area High (VAH) | Value Area Low (VAL) |
| 3.430 | 3.917 | 3.161 |
As long as OP USDT trades within this high volume range between $3.161-$3.917, it increases the chances of the current trend continuing in the short-run.
Relative Strength Index (RSI) Levels
The relative strength index (RSI) is currently at 58.92, indicating the market has modest upside momentum remaining. However, traders will be watching for an overbought reading above 70 which could potentially lead to a minor pullback. As long as the RSI stays above 50, it signals the short-term bullish bias is intact.
Current RSI Level: 58.92
Trade Bias
Based on the preponderance of evidence across timeframe charts and indicators, the current bias favors the long side in OP USDT with targets toward $3.531 Fib level initially and $3.399 beyond that.
Trade Bias: Long
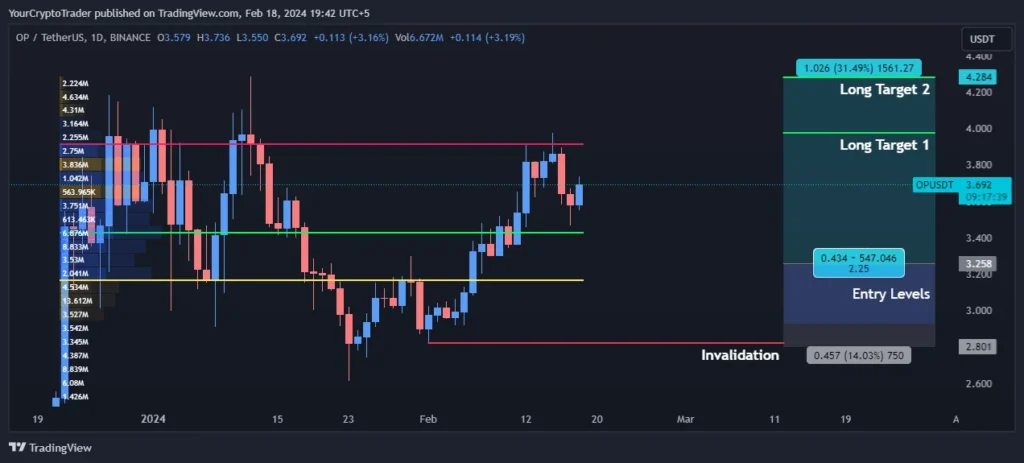
Entry Levels
Traders looking to enter long positions could consider the following entry opportunities:
- Entry Level 1 – $3.254. Slightly below the Point of Control on greater chances of a bounce from this area of demand.
- Entry Level 2 – $2.928. Aggressive long entry near the top of Support Zone 2 for a potential breakout towards $3.254.
Tight stop-losses below recent swing lows will help manage risk on any potential long positions.
| Entry Level Zone Number | Entry Level Price |
| Entry Levels 1 | 3.254 |
| Entry Levels 2 | 2.928 |
Invalidation Levels
The key level to watch against on current long positions is $2.822. A daily close below this level could signal the start of a larger pullback towards the 200 EMA at $2.425.
| Invalidation Type (Long, Short) | Invalidation Price |
| Long | 2.822 |
Target Levels
Traders may aim to take partial profits on any long positions at the following targets:
- Long Target 1 – $3.972. Top boundary of the Range and 0.382 Fib level area.
- Long Target 2 – $4.277. 0.5 Fib level projected extension based on recent range.
| Target Level | Target Price |
| Long Target 1 | 3.972 |
| Long Target 2 | 4.277 |