The current price of OP USDT is 3.698 according to the 1 hour chart data. Let us take a deeper look at the key technical levels to gain insights on the short term price trend and potential trading opportunities. A technical analysis incorporating multiple timeframes can help identify the overall market structure and potential areas of support, resistance, and trend continuation or reversal.
Multiple time frame technical analysis reveals a confluence of factors supporting a further upside in OP USDT over the near term. Traders can consider fresh long entries on dips with defined risk management levels. Upside appears to have more room in the absence of any bearish reversals. Maintaining a disciplined trading approach by partly taking profits around targets and stopping out below decisive breakdown zones would help navigate this volatility. Let price action and volume profile guide further decisions.
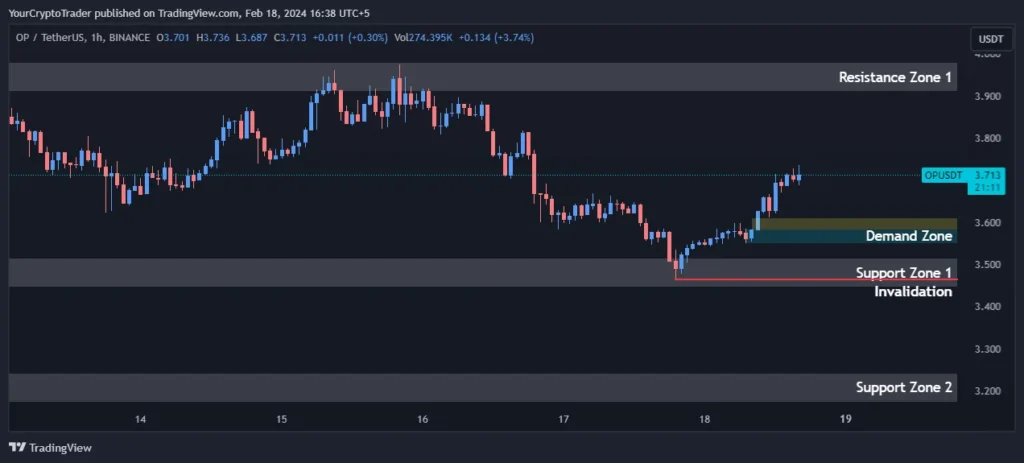
Support Levels
The support zones identified on the 1 hour chart are critical areas where buying interest is likely to emerge to defend further downside. The immediate support zone is between 3.446-3.516. A breakdown below this zone would shift the intraday bias more bearish. The next support lies between 3.174-3.242 which overlaps with the 0.382 Fibonacci retracement level of 3.629. Holding above these support zones keeps the bullish bias intact.
| Support Zone Number | Price High | Price Low |
| Support Zone 1 | 3.446 | 3.516 |
| Support Zone 2 | 3.174 | 3.242 |
Resistance Levels
Resistance zones are price areas where selling pressure is expected to increase as traders booking profits meet new entering sellers. The first resistance zone is between 3.911-3.979. A push above this could invite more buy-side momentum. Breakouts above resistance zones are usually needed to sustain an uptrend.
| Resistance Zone Number | Price High | Price Low |
| Resistance Zone 1 | 3.911 | 3.979 |
Fibonacci Retracement Levels
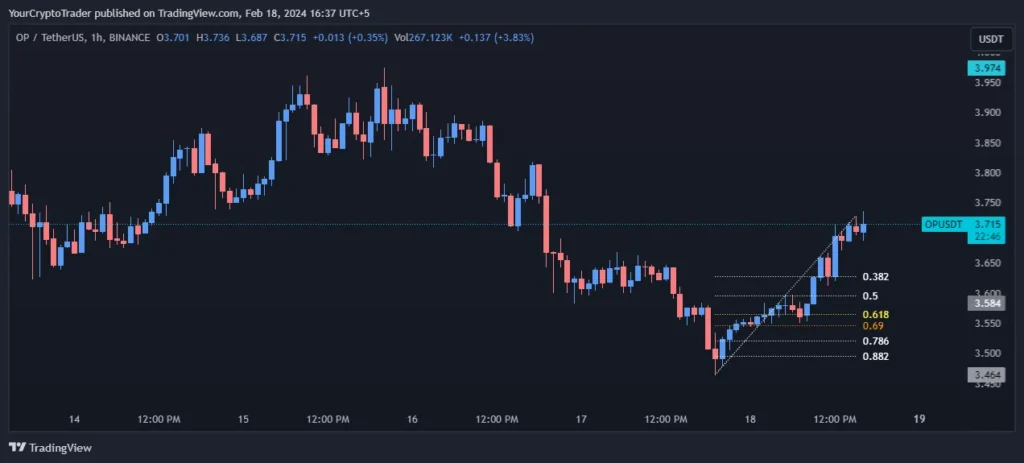
Fibonacci retracement tools are extremely helpful in identifying key support and resistance areas during trend corrections. The 0.382, 0.5, 0.618, 0.786 and 0.882 Fibonacci levels provide context on potential upside targets or downside levels where buyers may step in again. The 0.618 level at 3.565 would be an important support to watch during any intraday dips.
| Fib Retracement Value | Price |
| 0.382 Fib Level | 3.629 |
| 0.50 Fib Level | 3.597 |
| 0.618 Fib Level | 3.565 |
| 0.786 Fib Level | 3.520 |
| 0.882 Fib Level | 3.495 |
Demand Zones
Demand zones denote heavy concentration of bids that absorbed selling pressure in the past. They often act as support during corrections. The demand zone between 3.585-3.550 lines up with the 0.618 Fib level and should anchor the price during down moves. Holding above this increases the odds of resumption of the upward trend.
| Demand Zone Number | Price High | Price Low |
| Demand Zone | 3.585 | 3.550 |
Fair Value Gaps / Imbalances (FVG)
Fair value gaps (FVG) represent intraday imbalances that tend to be filled. The bullish FVG between 3.582-3.612 could provide fuel for another leg higher as price aims to cover this gap region. Breakouts above FVGs often invite momentum.
| FVG Zone Number | Price High | Price Low |
| Bullish FVG | 3.582 | 3.612 |
Exponential Moving Averages (EMA) Levels
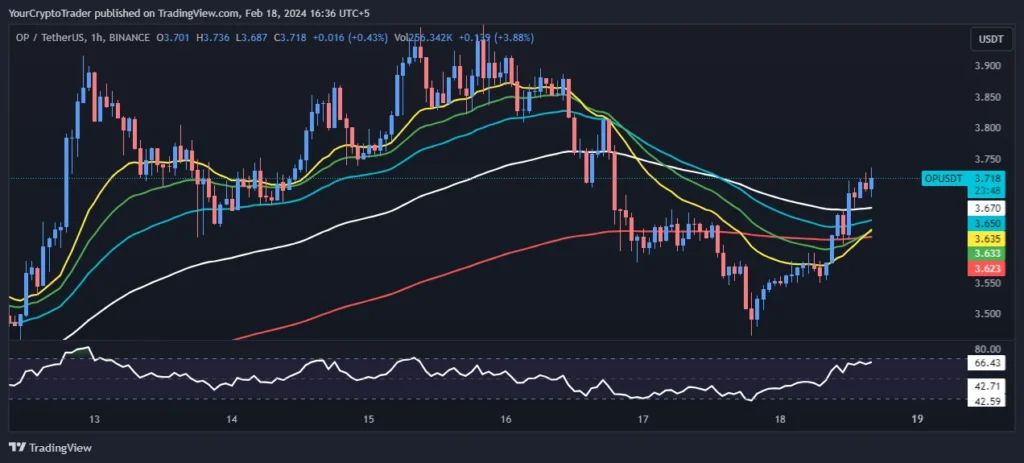
The short term EMAs – 21, 34 and 55 are holding in bullish alignment above the longer term 100 and 200 EMAs offering support to the current uptrend. As long as the price holds above the EMA ribbons, the bullish structure remains intact. A crossover of the short EMAs below the longer ones would signal a potential trend reversal.
| EMA Type | EMA Price on Chart |
| 200 EMA (Red Color) | 3.623 |
| 100 EMA (White Color) | 3.670 |
| 55 EMA (Blue Color) | 3.649 |
| 34 EMA (Green Color) | 3.613 |
| 21 EMA (Yellow Color) | 3.632 |
Fixed Range Volume Profile Levels
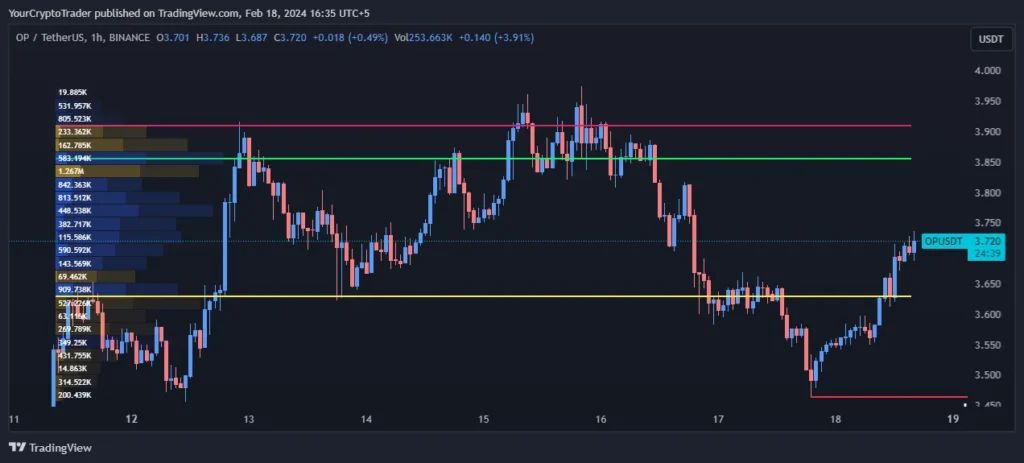
The volume profile reveals heavy concentration of volume between 3.630-3.909 with the point of control or balance point at 3.856 reinforcing this zone as a demand cluster. The area between value area high (VAH) and low (VAL) sees high participation of market participants.
| Point of Control (POC) | Value Area High (VAH) | Value Area Low (VAL) |
| 3.856 | 3.909 | 3.630 |
Relative Strength Index (RSI) Levels
The RSI is currently sitting at 62.48 well within the bullish territory above the midpoint level of 50. This signals more buying power remains. As long as RSI stays above 50, odds remain tilted in favor of upside. Dips below 50 could bring some consolidation before the next leg up may potentially unfold.
Current RSI Level: 62.48
Trade Bias
Considering the preponderance of technical evidence, the current intraday bias for OP USDT remains long with an upside target of 3.848 in the near term.
Trade Bias: Long
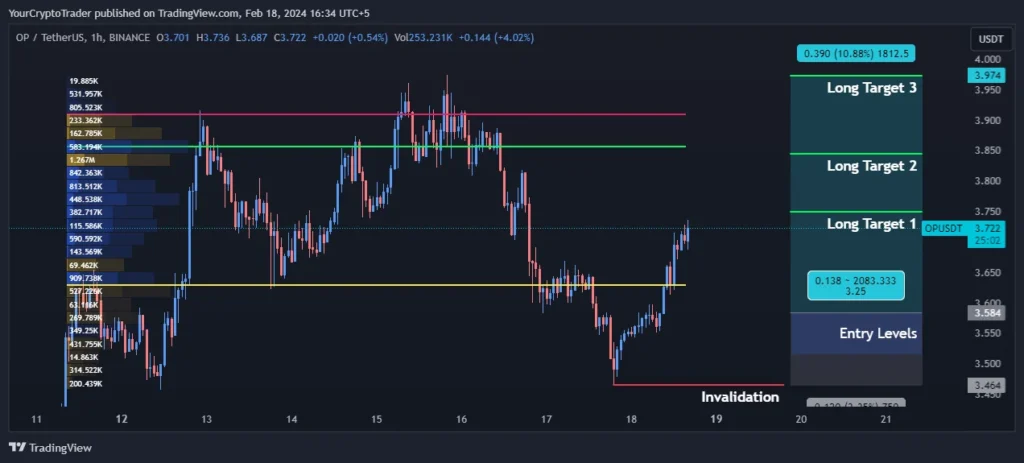
Entry Levels
Traders can consider entering fresh long positions on dips towards the support zones between 3.584-3.515. Tight stops below 3.464 would help mitigate against potential downside risks.
| Entry Level Zone Number | Entry Level Price |
| Entry Levels 1 | 3.584 |
| Entry Levels 2 | 3.515 |
Invalidation Levels
A breakdown below the key support of 3.464 would negate the bullish view and shift focus lower towards the next support zone at 3.174-3.242, potentially calling for closing of existing long positions.
| Invalidation Type (Long, Short) | Invalidation Price |
| Long | 3.464 |
Target Levels
If the support holds and bullish structure remains intact, price could potentially rise towards 3.748 in the first wave, 3.844 in the second and 3.973 in the third wave. Partial profit booking is advisable around these targets while trailing the stop upwards.
| Target Level | Target Price |
| Long Target 1 | 3.748 |
| Long Target 2 | 3.844 |
| Long Target 3 | 3.973 |