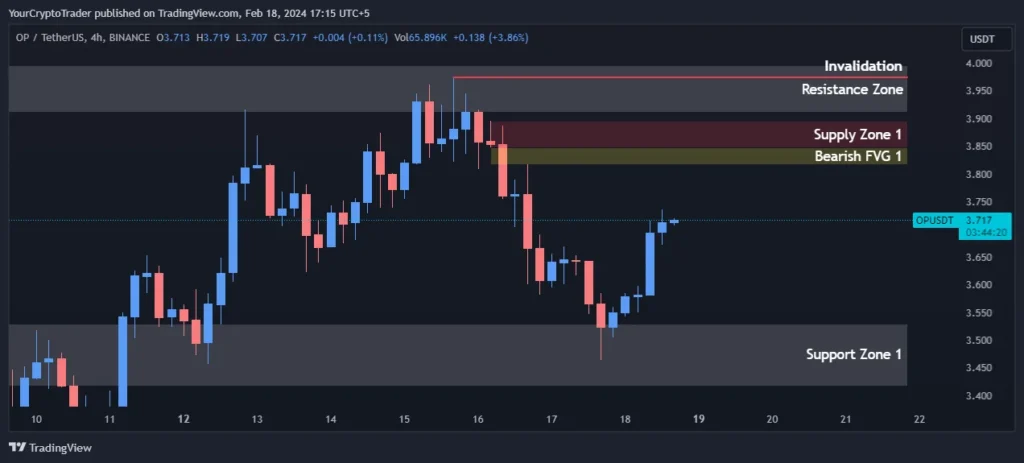
The current price of OP USDT is 3.698. The chart presents a bearish overall the technical picture suggests bears are currently in control. Traders may look to enter short rallies with price action and volume behavior for guidance. The analysis highlights multiple confluence points for potential short opportunities with defined risk.
Support Levels
Key support lies at Support Zone 1 between 3.418-3.530. A break below this zone could see further downside towards the 200 EMA at 3.362.
| Support Zone Number | Price High | Price Low |
| Support Zone | 3.418 | 3.530 |
Resistance Levels
Resistance is seen at the Resistance Zone between 3.911-3.996. For the bearish view to invalidate, price must break decisively above this zone on significant volume.
| Resistance Zone Number | Price High | Price Low |
| Resistance Zone | 3.911 | 3.996 |
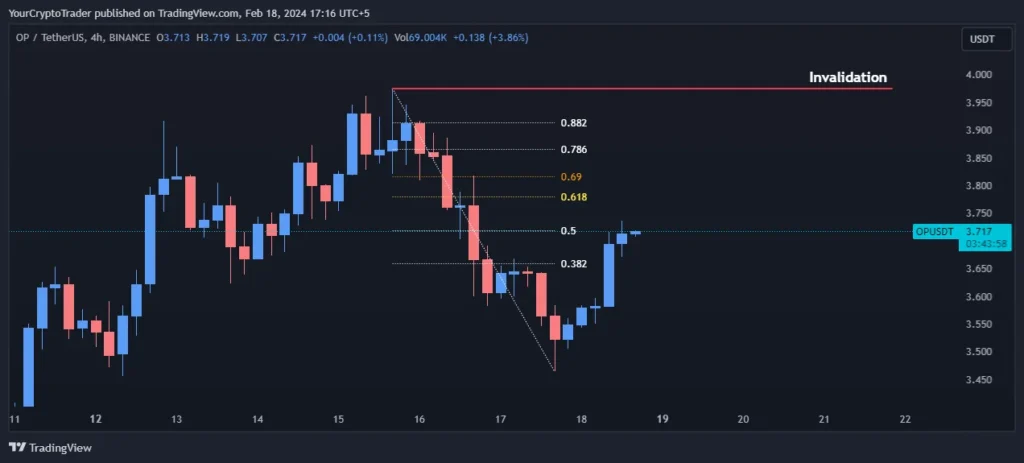
Fibonacci Retracement Levels
The 0.382, 0.50, and 0.618 Fib retracement levels sit between 3.658-3.779 and could provide resistance to any relief rallies in the bearish phase.
| Fib Retracement Value | Price |
| 0.382 Fib Level | 3.658 |
| 0.50 Fib Level | 3.719 |
| 0.618 Fib Level | 3.779 |
| 0.786 Fib Level | 3.865 |
| 0.882 Fib Level | 3.914 |
Supply Zones
Supply is seen stacking up at the Supply Zone between 3.895-3.847. Break above this zone would weaken bearish momentum.
| Supply Zone Number | Price High | Price Low |
| Supply Zone | 3.895 | 3.847 |
Fair Value Gaps / Imbalances (FVG)
A bearish FVG sits between 3.847-3.817 which adds pressure on existing shorts.
| FVG Zone Number | Price High | Price Low |
| Bearish FVG | 3.847 | 3.817 |
Exponential Moving Averages (EMA) Levels
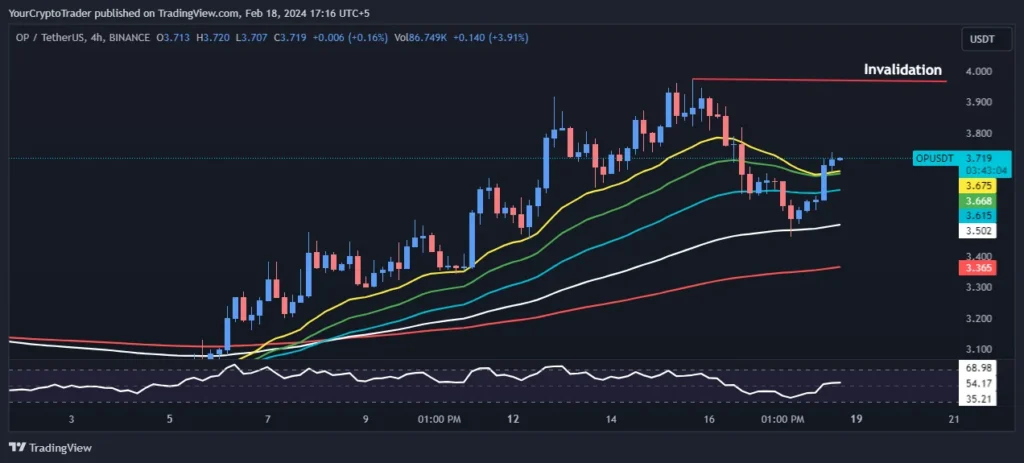
The EMA ribbons are bearishly stacked with the 21, 34, 55 EMAs below the 100 EMA. This signals underlying bearish momentum.
| EMA Type | EMA Price on Chart |
| 200 EMA (Red Color) | 3.362 |
| 100 EMA (White Color) | 3.500 |
| 55 EMA (Blue Color) | 3.613 |
| 34 EMA (Green Color) | 3.664 |
| 21 EMA (Yellow Color) | 3.671 |
Fixed Range Volume Profile Levels
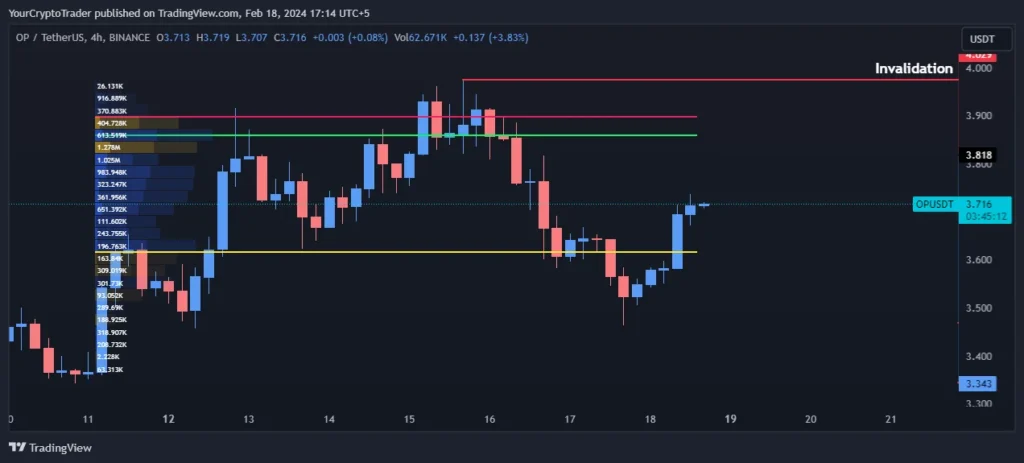
Volume activity has been decreasing below the POC of 3.861, further highlighting distribution under way.
| Point of Control (POC) | Value Area High (VAH) | Value Area Low (VAL) |
| 3.861 | 3.899 | 3.616 |
Relative Strength Index (RSI) Levels
The RSI is not extremely oversold and sits at 53.83, suggesting more downside is possible.
Current RSI Level: 53.83
Trade Bias
Given the preponderance of bearish technical evidence, the overall trade bias is short.
Trade Bias: Short
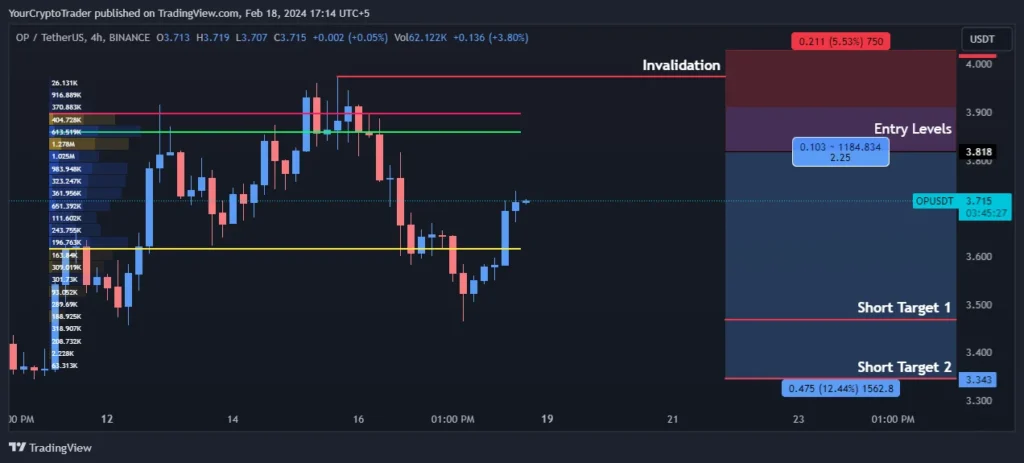
Entry Levels
Potential entries for shorts lie at Entry Level 1 of 3.820 and Entry Level 2 of 3.912
| Entry Level Zone Number | Entry Level Price |
| Entry Levels 1 | 3.820 |
| Entry Levels 2 | 3.912 |
Invalidation Levels
The invalidation level for short positions is 3.974.
| Invalidation Type (Long, Short) | Invalidation Price |
| Short | 3.974 |
Target Levels
Downside targets on a break of support include Short Target 1 at 3.468 and Short Target 2 at 3.345.
| Target Level | Target Price |
| Short Target 1 | 3.468 |
| Short Target 2 | 3.345 |