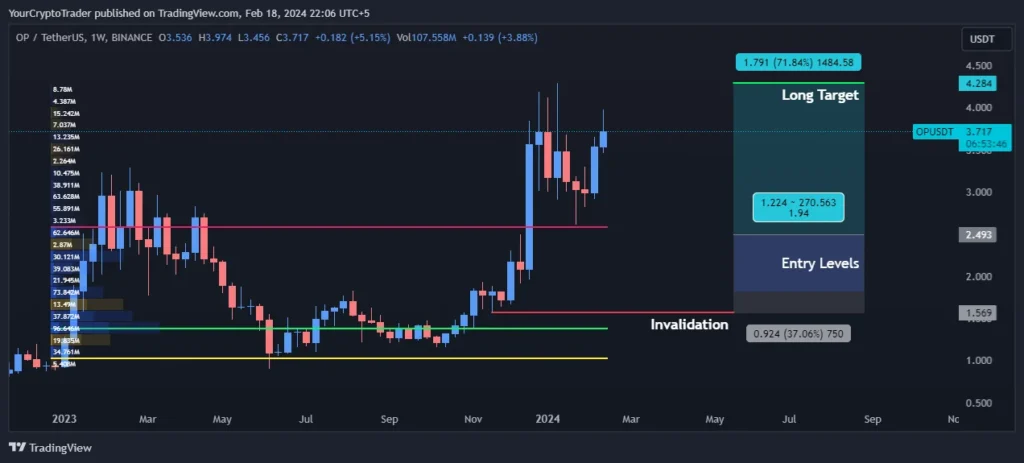
OP USDT remains in an overall uptrend based on the technical structures. Pullbacks to demand zones and support levels provide low-risk entries to capitalize on the bullish momentum with an initial target of $4.285.
The current price is trading at $3.681. Let us analyze the key support, resistance, and trend indicator levels.
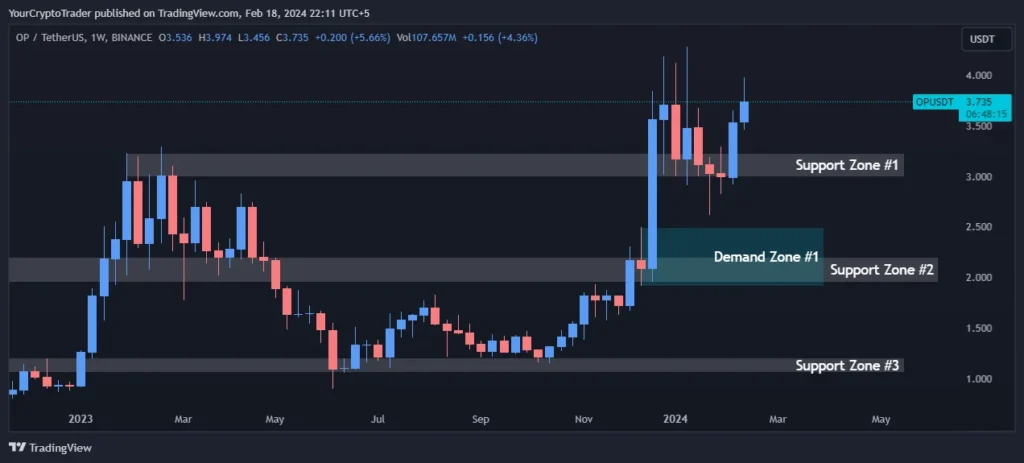
Support Levels
The strongest support lies between $2.997-$3.229 (Support Zone #1). Below this, we have supports at $1.952-$2.200 (Zone #2) and $1.059-$1.201 (Zone #3). Unless one of these supports is broken on a closing weekly basis, the long-term trend remains up.
| Support Zone Number | Price High | Price Low |
| Support Zone #1 | 3.229 | 2.997 |
| Support Zone #2 | 2.200 | 1.952 |
| Support Zone #3 | 1.201 | 1.059 |
Fibonacci Retracement Levels
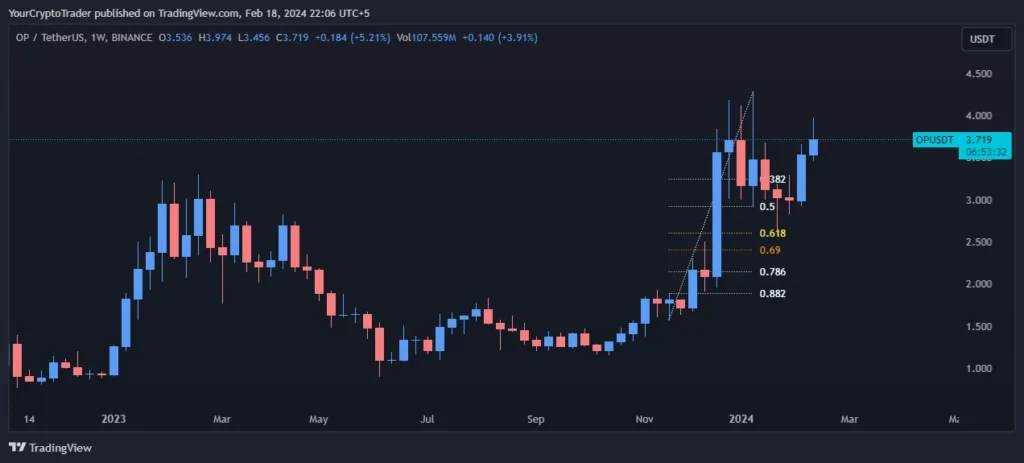
Fibonacci retracement levels of $3.244, $2.931, $2.604 respectively. A break above these levels could see further upside momentum.
| Fib Retracement Value | Price |
| 0.382 Fib Level | 3.244 |
| 0.50 Fib Level | 2.931 |
| 0.618 Fib Level | 2.604 |
| 0.786 Fib Level | 2.149 |
| 0.882 Fib Level | 1.892 |
Demand Zones
Demand Zone between $1.910-$2.497 shows an area where buyers may step in on future dips.
| Demand Zone Number | Price High | Price Low |
| Demand Zone | 2.497 | 1.910 |
Exponential Moving Averages (EMA) Levels
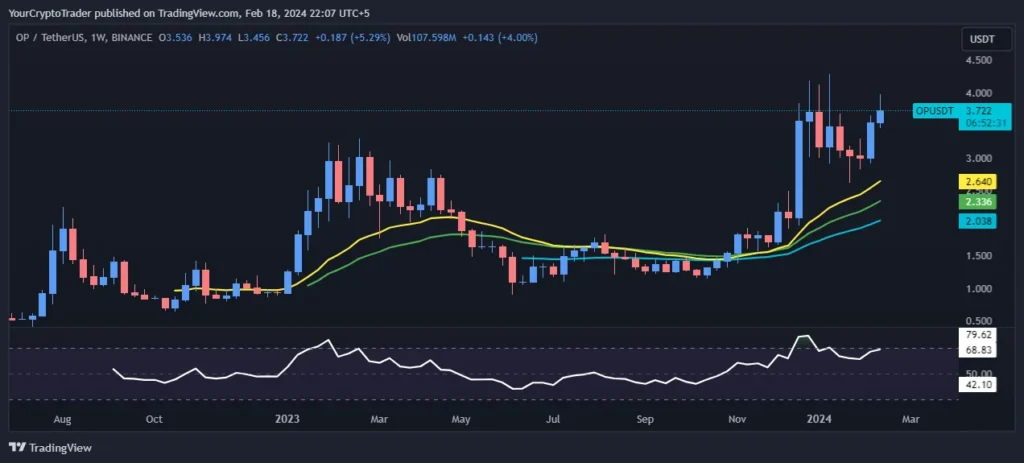
The price is trading comfortably above the 21, 34, 55 EMAs signaling an uptrend in short to medium term.
| EMA Type | EMA Price on Chart |
| 55 EMA (Blue Color) | 2.036 |
| 34 EMA (Green Color) | 2.334 |
| 21 EMA (Yellow Color) | 2.637 |
Fixed Range Volume Profile Levels
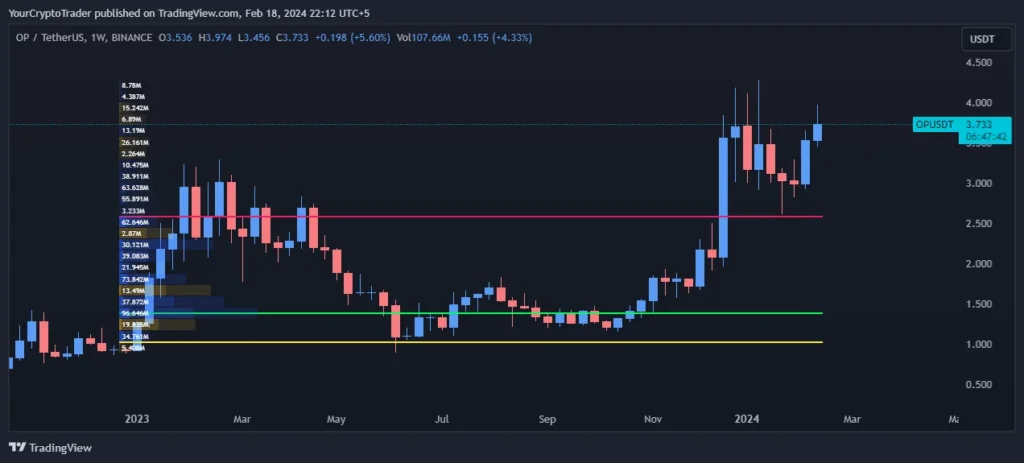
Price taking support at the Value Area Low of $1.023 strengthens the bullish case.
| Point of Control (POC) | Value Area High (VAH) | Value Area Low (VAL) |
| 1.375 | 2.951 | 1.023 |
Relative Strength Index (RSI) Levels
RSI at 70.72, there are signs of short-term overbought conditions. This could lead to range bound or downward movement in the near future before resuming the uptrend.
Current RSI Level: 70.72
Trade Bias
Based on the above factors, the overall trade bias remains long term bullish above the key supports
Trade Bias: Long
Entry Levels
New long entries can be considered at $2.493 or $1.814 on future dips while maintaining adequate risk management.
| Entry Level Zone Number | Entry Level Price |
| Entry Levels 1 | 2.493 |
| Entry Levels 2 | 1.814 |
Invalidation Levels
Our bullish view gets invalidated if the price closes below $1.569 on a weekly basis.
| Invalidation Type (Long, Short) | Invalidation Price |
| Long | 1.569 |
Target Levels
Initial long target is seen at the 0.786 Fib retracement level of $4.285. However, targets may be revised based on future price action and volatility.
| Target Level | Target Price |
| Long Target | 4.285 |