Polkadot DOT USDT faces resistance in the $7.20- $7.25 zone on the short term timeframes. Weekly and daily analysis points to stronger resistance between $8.43 – $8.61 where bears may look to initiate new short positions.
Support lies around current prices and below $6.70 on the daily timeframe. A break of either could signal the next major move.
Weekly Timeframe
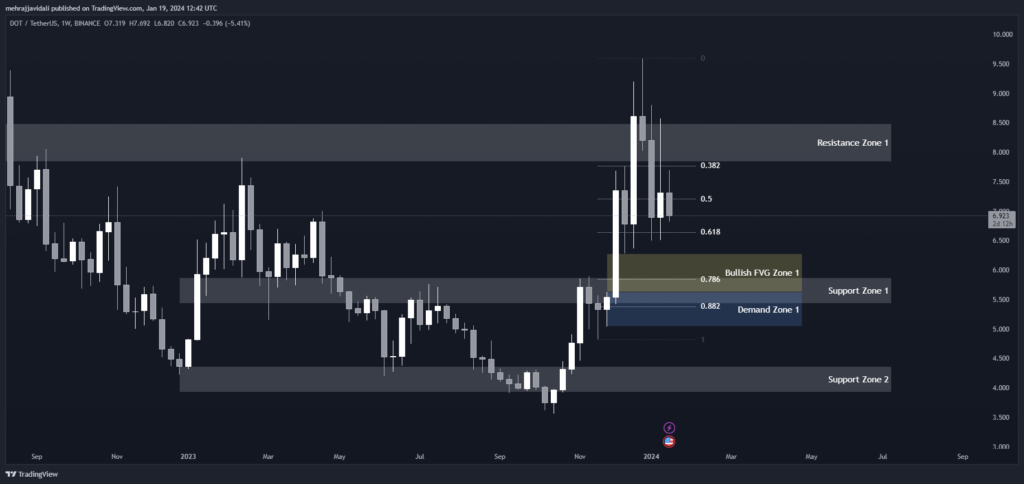
On the weekly timeframe, we can see that Polkadot has found strong support between $5.43- $5.878 over the past few months.
This zone aligns with the 0.618 Fibonacci retracement level of $6.643. If price breaks below this zone, it would indicate a change in the larger uptrend and further declines toward the next support zone between $3.923- $4.371.
On the upside, resistance lies between $7.84 – $8.49, with the 0.50 and 0.382 Fibonacci levels acting as resistance at $7.204 and $7.766 respectively. A break above this resistance zone could see price target the all time highs near $10.
Support and Resistance Levels
| S / R Type | High | Low |
| Support Zone 1 | 5.878 | 5.430 |
| Support Zone 2 | 3.923 | 4.371 |
| Resistance Zone 1 | 8.490 | 7.840 |
Fibonacci Retracement Levels
| 0.382 | 7.766 |
| 0.50 | 7.204 |
| 0.618 | 6.643 |
| 0.786 | 5.841 |
| 0.882 | 5.382 |
Demand Zone
| Zone Number | High | Low |
| Demand Zone 1 | 5.624 | 5.037 |
Fair Value Gaps / Imbalances
| Gap Number | High | Low |
| Bullish FVG Zone 1 | 6.285 | 5.624 |
Daily Timeframe
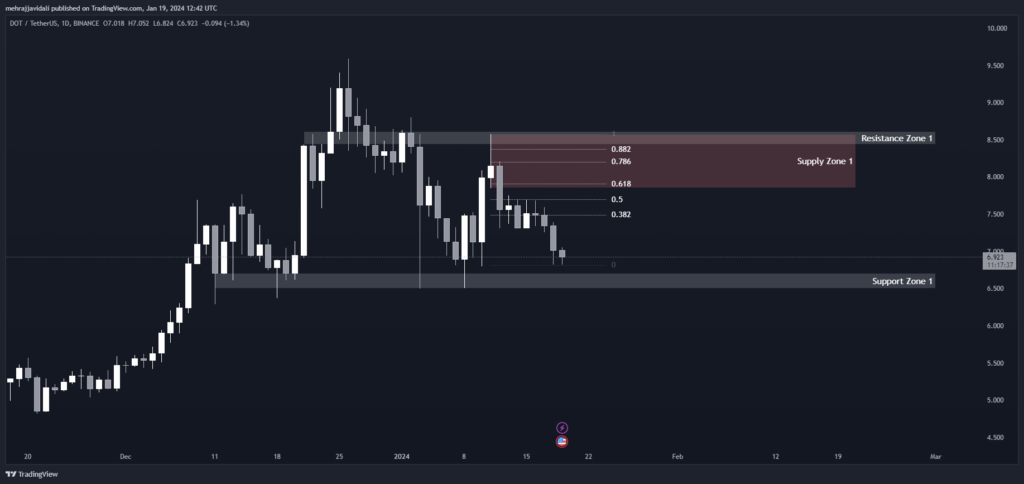
Zooming into the daily chart, we see Polkadot testing strong resistance in the $8.435 – $8.612 zone over the past week.
This level aligns with the weekly resistance. If buyers can push price above here, it would be a bullish sign. Support lies just below at $6.496 – $6.709. Keeping above this zone maintains the short term uptrend.
The demand zone between $5.624 – $5.037 from the weekly timeframe also comes into play on the daily.
Support and Resistance Levels
| S / R Type | High | Low |
| Resistance Zone 1 | 8.612 | 8.435 |
| Support Zone 1 | 6.709 | 6.496 |
Fibonacci Retracement Levels
| 0.382 | 7.486 |
| 0.50 | 7.696 |
| 0.618 | 7.905 |
| 0.786 | 8.205 |
| 0.882 | 8.370 |
Supply Zone
| Zone Number | High | Low |
| Supply Zone 1 | 8.580 | 7.850 |
1 Hour Timeframe
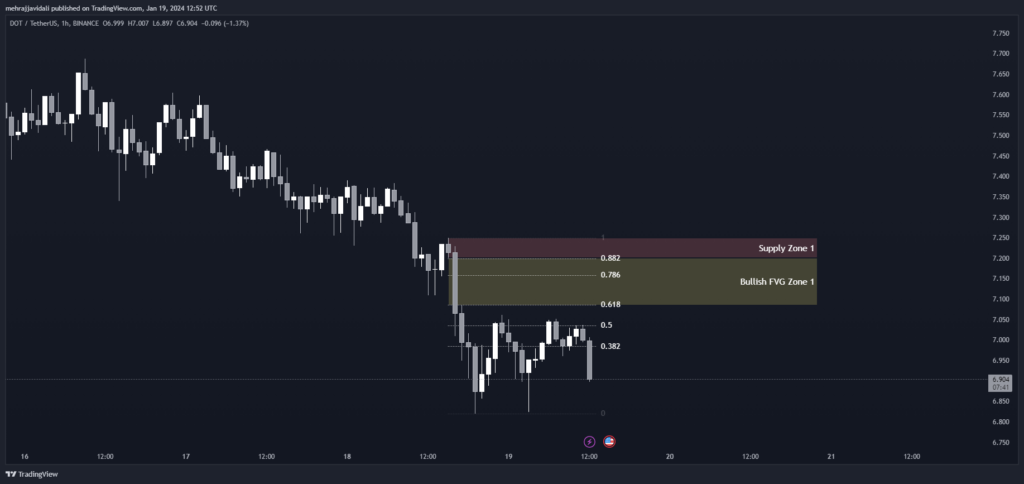
Zooming into the 1hr chart, we can see Polkadot is currently retesting the $7.086 Fibonacci level after facing rejection at $7.199 earlier.
This level aligns with the 4hr supply zone. If we break below here, the next support sits at $6.984 (0.382 Fib).
A break back above $7.200 would turn momentum positive again in the very short term. Keeping above $7 could see a retest of $7.250 resistance.
Fibonacci Retracement Levels
| 0.382 | 6.984 |
| 0.50 | 7.035 |
| 0.618 | 7.086 |
| 0.786 | 7.158 |
| 0.882 | 7.199 |
Supply Zone
| Zone Number | High | Low |
| Supply Zone 1 | 7.250 | 7.200 |
Fair Value Gaps / Imbalances
| Gap Number | High | Low |
| Bullish FVG Zone 1 | 7.200 | 7.085 |