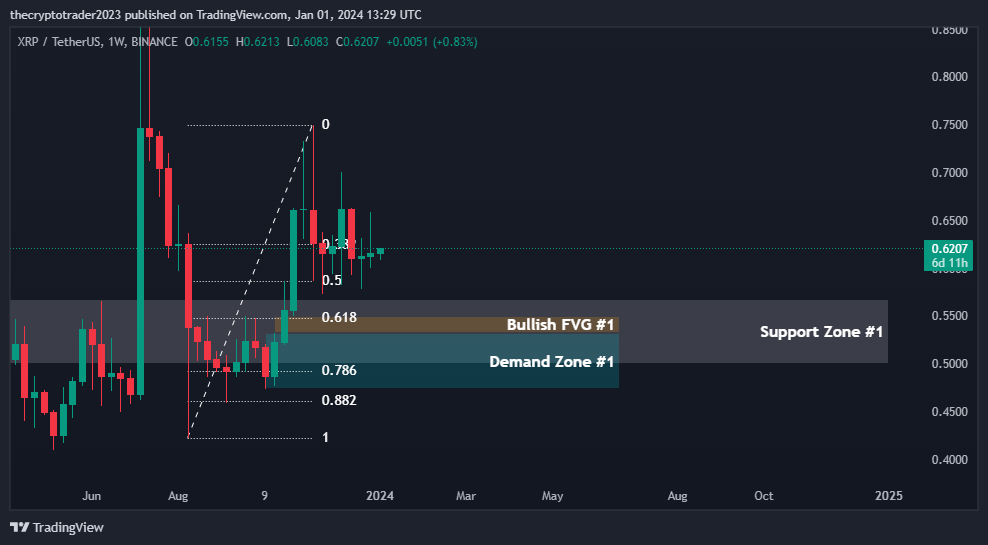
The areas between $0.5300-.5400 present a confluence of demand zones, fibonacci levels and support which make for potential bullish trade opportunities. Follow signals on decreasing timeframes for sound risk management.
The price is currently finding support between $0.4993-0.5678 (support zone 1). Above that is resistance zone 1 between $0.8649-0.9380. The .618 Fibonacci retracement level sits at $0.5478 which lines up with demand zone 1 low of $0.5325. This presents an area of interest for potential long opportunities. Watch for signals of bullish momentum to form on lower timeframes in this area.
Support and Resistance Levels
S/R Type
High
Low
Support Zone #1
0.5678
0.4993
Support Zone #2
0.3439
0.2936
Resistance Zone #1
0.9380
0.8649
Resistance Zone #2
1.4180
1.3075
Fibonacci Retracement Levels
0.382
0.6246
0.50
0.5872
0.618
0.5478
0.786
0.4917
0.882
0.4617
Supply Zone
Zone Number
High
Low
Supply Zone #1
0.8547
0.7601
Demand Zone
Zone Number
High
Low
Demand Zone #1
0.5325
0.4729
Fair Value Gaps / Imbalances
Gap Number
High
Low
Bullish FVG #1
0.5494
0.5325
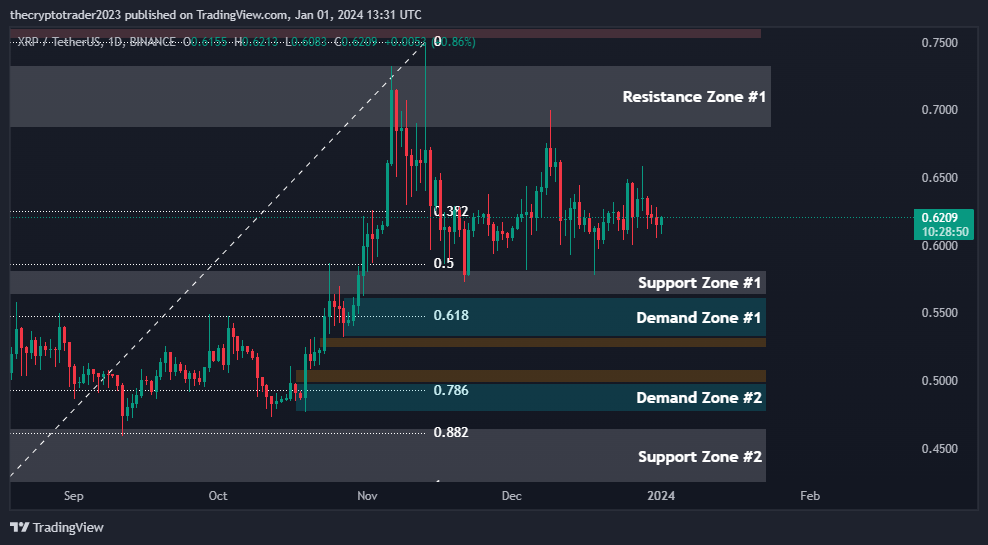
Daily Timeframe
Within the weekly support zone 1, daily demand zones provide entries between $0.4729-0.5325 (zone 1) and $0.4769-0.4980 (zone 2). The .50 Fibonacci level at $0.5859 adds to this area of interest. Keep an eye on bullish divergences or bullish candlestick patterns forming around $0.5300 as potential early entry signals.
Support and Resistance Levels
S/R Type
High
Low
Support Zone #1
0.5820
0.5630
Support Zone #2
0.4649
0.4229
Resistance Zone #1
0.7333
0.6866
Fibonacci Retracement Levels
0.382
0.6251
0.50
0.5859
0.618
0.5481
0.786
0.4934
0.882
0.4608
Supply Zone
Zone Number
High
Low
Supply Zone #1
0.8547
0.7601
Demand Zone
Zone Number
High
Low
Demand Zone #1
0.5614
0.5325
Demand Zone #2
0.4980
0.4769
Fair Value Gaps / Imbalances
Gap Number
High
Low
Bullish FVG #1
0.5325
0.5242
Bullish FVG #2
0.5084
0.4980
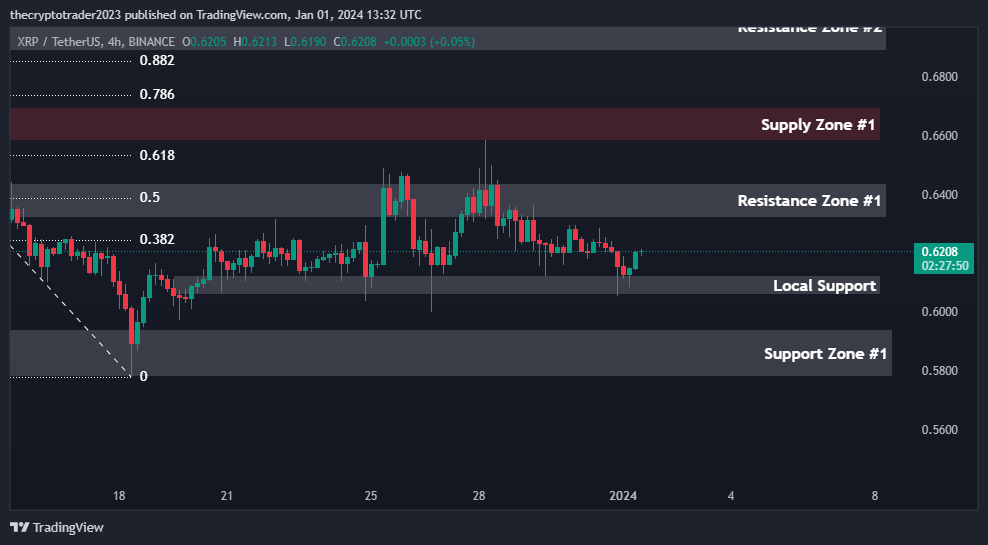
4 Hour Timeframe
Zooming in, we see support formed at $0.5778-.5941 on the 4-hour chart. Look for a bounce from this level or a move up through resistance at $0.6320-.6439 as a confirming signal. The .382 and .50 Fibonacci levels fall within this range at $0.6244 and $0.6390 respectively.