On the 4-hour timeframe of XRP USDT, a break above $0.6127-0.6056 could ignite gains towards $0.6439-0.6320. However, bears would gain control on a close below $0.5379. On the 1-hour chart, ranges of $0.5113-0.5160 and $0.5288-0.5238 are likely to trigger the next move.
4 Hour Timeframe
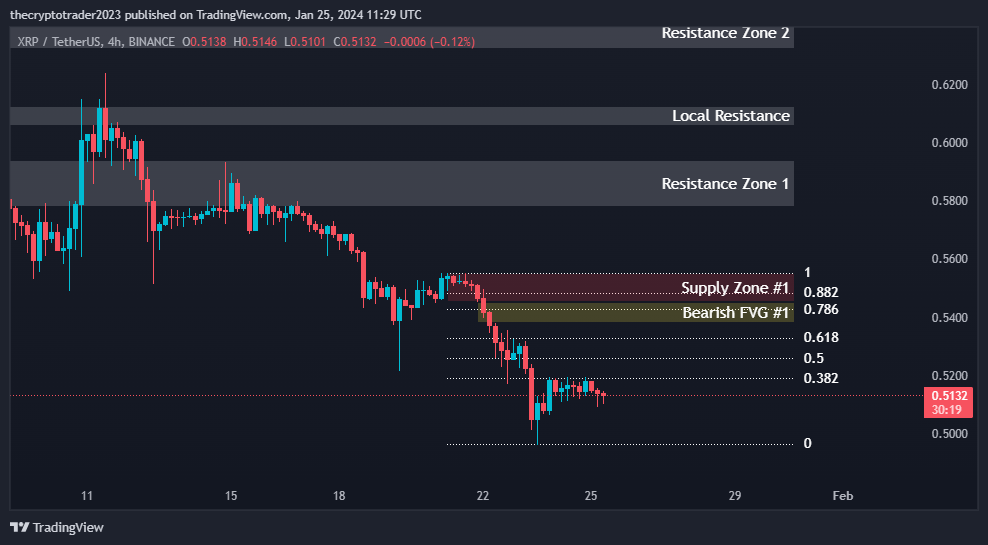
Currently, Ripple (XRP USDT) is trading at $0.5129 on the 4-hour timeframe. Let us analyze the key support and resistance levels as well as trends on multiple timeframes.
Support and Resistance Levels
As seen in the chart above, there are three significant resistance levels above the current price – Level 1 at $0.5941-0.5778, Level 2 at $0.6439-0.6320 and Level 3 at $0.7056-0.6888.
Breakout above Resistance Level 3 could signal continuation of the upside momentum. The nearest support lies at the local resistance level of $0.6127-0.6056.
| S / R Type | High | Low |
| Resistance Level 1 | 0.5941 | 0.5778 |
| Resistance Level 2 | 0.6439 | 0.6320 |
| Resistance Level 3 | 0.7056 | 0.6888 |
| Local Resistance | 0.6127 | 0.6056 |
Fibonacci Retracement Levels
The price is currently situated between the 0.382 and 0.50 Fibonacci retracement levels of $0.5190 and $0.5259 respectively. A bounce from this region would indicate buyer interest.
| 0.382 | 0.5190 |
| 0.50 | 0.5259 |
| 0.618 | 0.5329 |
| 0.786 | 0.5428 |
| 0.882 | 0.5484 |
Supply Zone
Supports are expected around the 0.618 level of $0.5329 and the supply zone 1 between $0.5552-0.5451.
| Zone Number | High | Low |
| Supply Zone 1 | 0.5552 | 0.5451 |
Fair Value Gaps / Imbalances
The bearish fair value gap between $0.5451-0.5379 needs to be filled for the bullish momentum to sustain. A close below this region could trigger further weakness.
| Gap Number | High | Low |
| Bearish FVG 1 | 0.5451 | 0.5379 |
1 Hour Timeframe
Fibonacci Retracement Levels
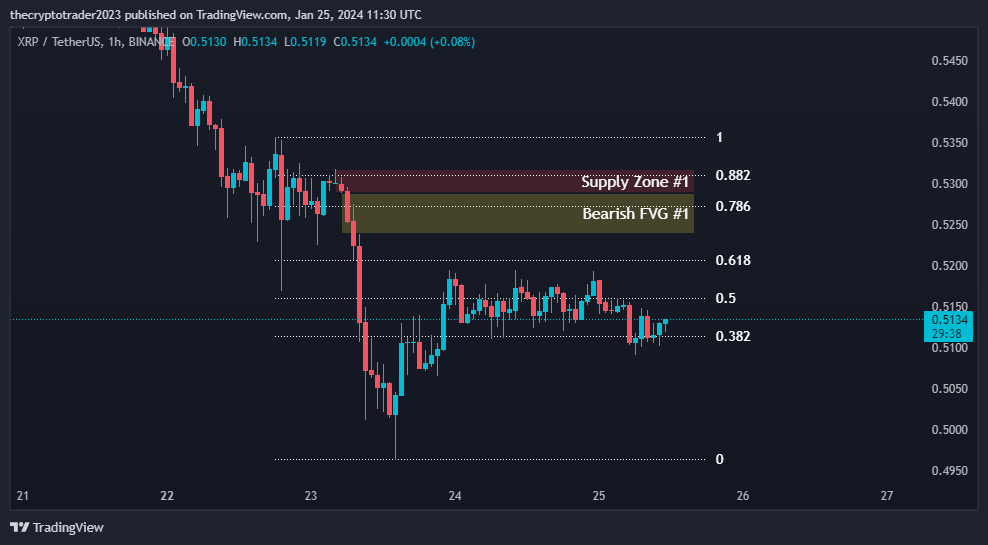
Examining the 1-hour chart of XRP USDT, we see that the price is right above the 0.382 Fibonacci retracement level of $0.5113. Supports are present at the 0.50 and 0.618 levels of $0.5160 and $0.5206 respectively.
| 0.382 | 0.5113 |
| 0.50 | 0.5160 |
| 0.618 | 0.5206 |
| 0.786 | 0.5272 |
| 0.882 | 0.5309 |
Supply Zone
Supply zone 1 from $0.5318-0.5288 acts as the nearest resistance. A break above this could push the price towards the 0.786 and 0.882 Fibonacci levels at $0.5272 and $0.5309.
| Zone Number | High | Low |
| Supply Zone 1 | 0.5318 | 0.5288 |
Fair Value Gaps / Imbalances
The bearish fair value gap between $0.5288-0.5238 needs to filled on an hourly closing basis for bulls to gain momentum.
| Gap Number | High | Low |
| Bearish FVG 1 | 0.5288 | 0.5238 |