In both the 4H and 1H analysis, 1000SATS USDT finds itself between support and resistance levels in the mid-range of the recent move. Overall, neutral conditions persist but nearby technical indicators provide zones to watch for a potential opportunity or further weakness depending on price direction.
Continued consolidation here is a very possible short-term outcome.
4 Hour Timeframe
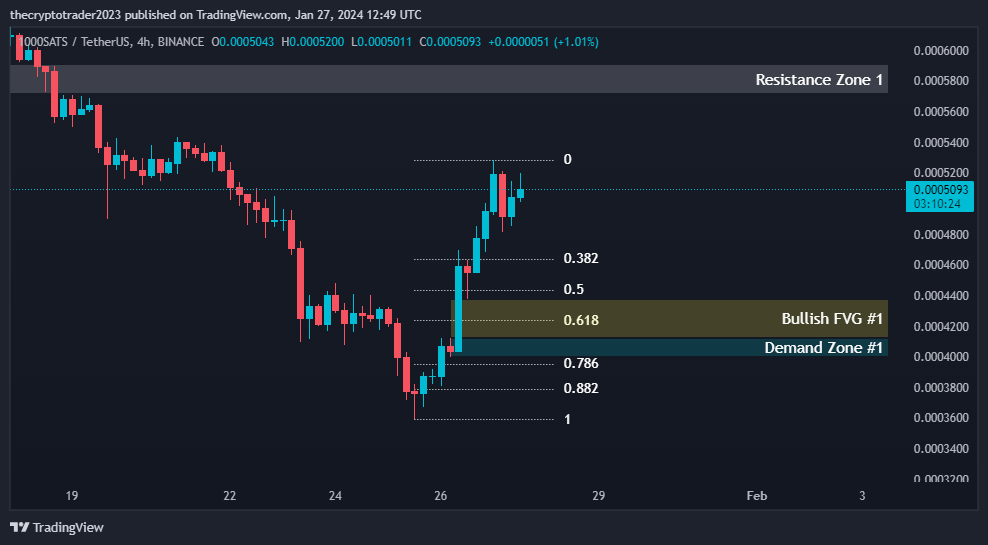
Currently, 1000SATS USDT is trading at 0.0005150 on the 4 hour timeframe. Let’s take a deeper look at some key technical indicators on this time frame.
On the 4H timeframe the current price action of 1000SATS USDT is neutral in the mid-range of the recent move. Demand Zone 1 and the bullish FVG provide nearby support, whilst the 50%-61.8% retracements lay overhead as potential resistance if we see upside in the near future.
Fibonacci Retracement Levels
The current price is in between the 50% (0.0004437) and 61.8% (0.0004238) Fibonacci retracement levels of the recent move up. This indicates we could see some potential resistance at these levels if price moves higher. Support lies at the 78.6% (0.0003955) and 88.2% (0.0003792) retracement levels if the cryptocurrency moves lower.
| 0.382 | 0.0004640 |
| 0.50 | 0.0004437 |
| 0.618 | 0.0004238 |
| 0.786 | 0.0003955 |
| 0.882 | 0.0003792 |
Demand Zone
We have an identified Demand Zone 1 between 0.0004119 – 0.0004001. This zone is an area where we could see buyers step in to potentially halt any downward momentum. It aligns well with the 88.2% retracement level.
| Zone Number | High | Low |
| Demand Zone 1 | 0.0004119 | 0.0004001 |
Fair Value Gaps / Imbalances
There is an identified Bullish FVG (Fair Value Gap) between 0.0004376 – 0.0004119. FVGs are areas where price discovery didn’t occur, so they tend to attract liquidity when revisited which can add volatility. This gap largely overlaps with Demand Zone 1.
| Gap Number | High | Low |
| Bullish FVG 1 | 0.0004376 | 0.0004119 |
1 Hour Timeframe
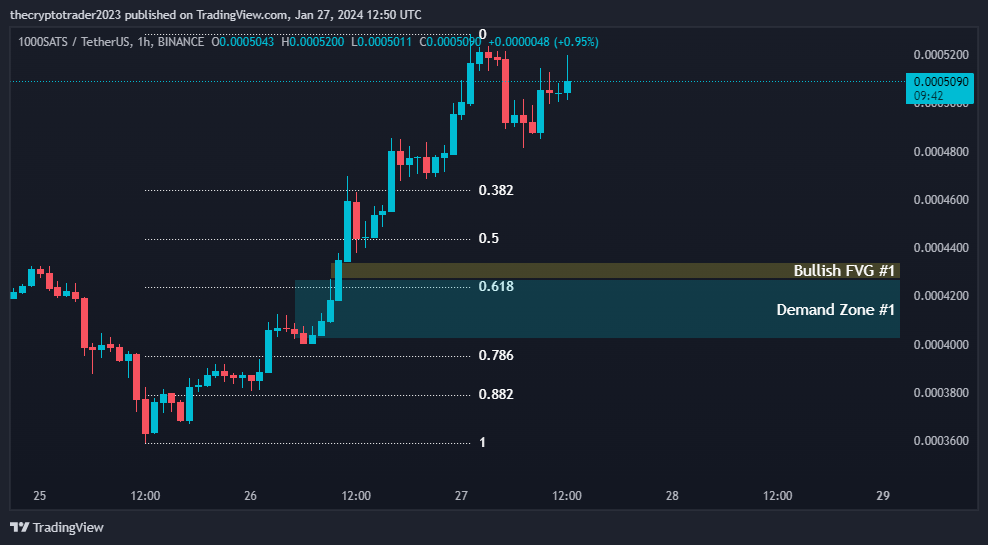
On the shorter 1H timeframe of 1000SATS USDT, the technical picture closely mirrors that of the 4H. Price action remains neutral within retracement levels, whilst Demand Zone 1 and FVG provide potential support beneath the current price.
Fibonacci Retracement Levels
Price on the 1H is also in the middle of the 50% (0.0004435) and 61.8% (0.0004239) retracement levels of the last leg up. The 38.2% (0.0004635) level could provide resistance if tested.
| 0.382 | 0.0004635 |
| 0.50 | 0.0004435 |
| 0.618 | 0.0004239 |
| 0.786 | 0.0003952 |
| 0.882 | 0.0003788 |
Support / Resistance Level
1000SATS USDT is currently stuck in a midpoint range defined by key support and resistance levels on both short and intermediate timeframes. A break in either direction could provide clues to the next larger move.
It’s advisable to wait for confirmation of a range break before entering, with support/demand zones and Fibonacci providing guideposts along the way. Patience and only taking high probability trades will serve traders best in this consolidative period.
| S/ R Type | High | Low |
| Resistance Level 1 | 0.0005913 | 0.0005712 |
Demand Zone
We see Demand Zone 1 identified between 0.0004272 – 0.0004020. This provides nearby support and aligns with the 1H 50% retracement level.
| Zone Number | High | Low |
| Demand Zone 1 | 0.0004272 | 0.0004020 |
Fair Value Gaps / Imbalances
A Bullish FVG is shown from 0.0004342 – 0.0004272. This gap overlaps Demand Zone 1 and could attract buying interest on a retest of this area.
| Gap Number | High | Low |
| Bullish FVG 1 | 0.0004342 | 0.0004272 |