Sei Network (SEI USDT) is currently rangebound on the weekly, daily and 4 hour timeframes. A break above daily and 4 hour resistance could resume the upside momentum with potential targets at 0.6298 and 0.7875 respectively.
Below, strong demand is expected between 0.4723-0.3618 on the weekly and 0.4983-0.4338 on the daily.
Traders can look for swing trade opportunities by entering on bounces off support or breaks of resistance.
Weekly Timeframe
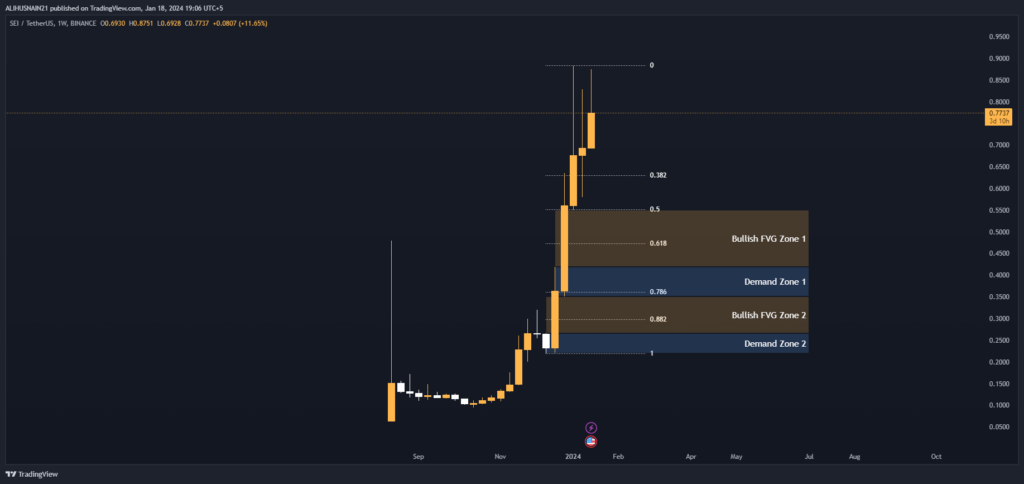
On the weekly timeframe, we can see that SEI USDT has retraced after reaching an all-time high of 0.8837 in early 01 January, 2024.
The price is currently finding support between the 0.4723 (0.786 Fibonacci retracement level) and 0.3618 (0.786 Fibonacci retracement level).
This zone between 0.4723-0.3618 is also bolstered by Demand Zone 1 between 0.4186-0.3508 and Demand Zone 2 between 0.2659-0.2194. If the weekly support zone breaks to the downside, we could see the price retrace further to test Demand Zone 2.
However, the strong cluster of demand factors in this zone makes it likely that the downside will be supported in the near future. Above the current price, resistance lies at the 0.6294 (0.382 Fibonacci retracement level) and the 0.50 (0.50 Fibonacci retracement level).
A weekly close above these levels would indicate the start of a new uptrend. There are also two bullish fair value gap zones above between 0.5500-0.4186 and 0.3508-0.2659 which could act as upside targets if a rally begins.
Fibonacci Retracement Levels
| 0.382 | 0.6294 |
| 0.50 | 0.5514 |
| 0.618 | 0.4723 |
| 0.786 | 0.3618 |
| 0.882 | 0.2978 |
Demand Zone
| Zone Number | High | Low |
| Demand Zone 1 | 0.4186 | 0.3508 |
| Demand Zone 2 | 0.2659 | 0.2194 |
Fair Value Gaps / Imbalances
| Gap Number | High | Low |
| Bullish FVG Zone 1 | 0.5500 | 0.4186 |
| Bullish FVG Zone 2 | 0.3508 | 0.2659 |
Daily Timeframe
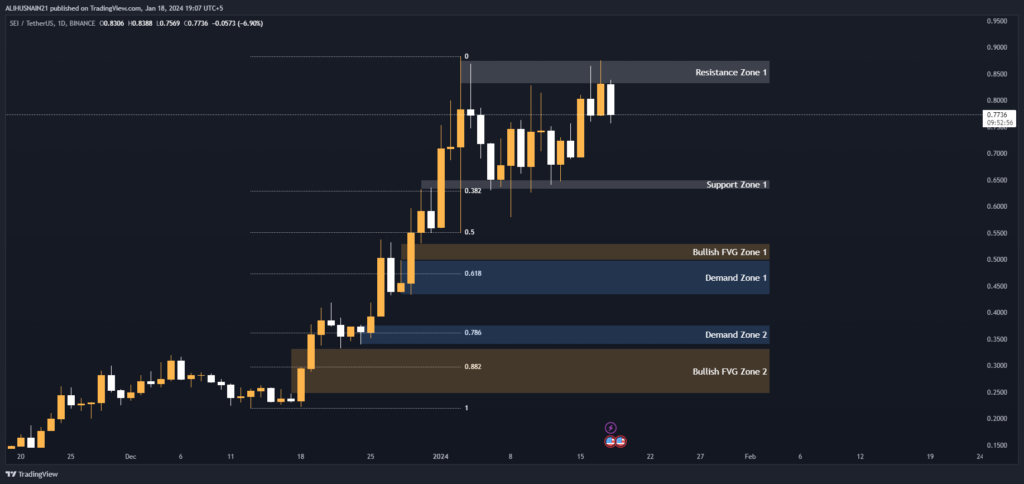
On the daily chart, SEI USDT found immediate support at the 0.618 Fibonacci retracement level of 0.4731 after the weekly retrace began. It has since rebounded and is currently trapped between the resistance zone of 0.8751-0.8309 and support zone of 0.6503-0.6321.
A daily close above resistance would be a bullish signal for further upside potential with targets at the 0.382 Fibonacci retracement of 0.6298 and the 0.50 Fibonacci retracement of 0.5499.
Below support, Demand Zone 1 between 0.4983-0.4338 and Demand Zone 2 between 0.3764-0.3398 should cushion any downside.
There are also two bullish fair value gaps above between 0.5300-0.4983 and 0.3318-0.2468 which could propel the price higher if cleared.
For the bears to gain control, a daily close below 0.4731 is needed to expose the lower demand zones and fibonacci retracement levels.
Support and Resistance Levels
| S / R Type | High | Low |
| Resistance Zone 1 | 0.8751 | 0.8309 |
| Support Zone 1 | 0.6503 | 0.6321 |
Fibonacci Retracement Levels
| 0.382 | 0.6298 |
| 0.50 | 0.5499 |
| 0.618 | 0.4731 |
| 0.786 | 0.3611 |
| 0.882 | 0.2978 |
Demand Zone
| Zone Number | High | Low |
| Demand Zone 1 | 0.4983 | 0.4338 |
| Demand Zone 2 | 0.3764 | 0.3398 |
Fair Value Gaps / Imbalances
| Gap Number | High | Low |
| Bullish FVG Zone 1 | 0.5300 | 0.4983 |
| Bullish FVG Zone 2 | 0.3318 | 0.2468 |
4 Hour Timeframe
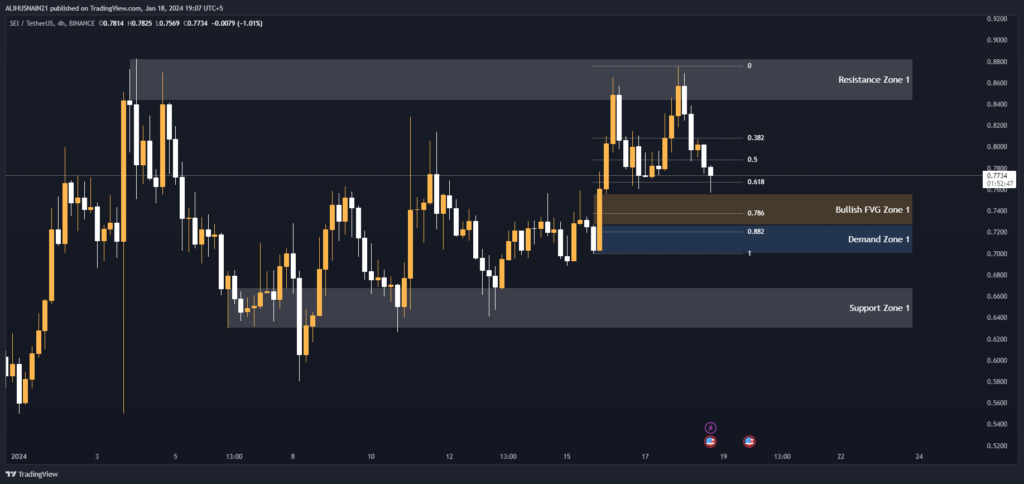
Zooming into the 4 hour chart, we can see that SEI USDT has been range bound between resistance at 0.8828-0.8436 and support at 0.6684-0.6300 for the past month.
The 0.618 Fibonacci retracement level at 0.7670 provided support during an inside bar on January 3rd, indicating indecision at that price point. Below, Demand Zone 1 between 0.7266-0.7000 should provide a bounce if support at 0.6684-0.6300 is broken.
There is also an open bullish fair value gap between 0.7559-0.7266 which could attract buyers on a retest. A break above 4 hour resistance would open up upside potential with targets at the 0.382 Fibonacci retracement of 0.8087 and the 0.50 Fibonacci retracement of 0.7875.
The 4 hour timeframe provides good visibility on potential swing trade set ups within the larger daily range.
Support and Resistance Levels
| S / R Type | High | Low |
| Resistance Zone 1 | 0.8828 | 0.8436 |
| Support Zone 1 | 0.6684 | 0.6300 |
Fibonacci Retracement Levels
| 0.382 | 0.8087 |
| 0.50 | 0.7875 |
| 0.618 | 0.7670 |
| 0.786 | 0.7375 |
| 0.882 | 0.7204 |
Demand Zone
| Zone Number | High | Low |
| Demand Zone 1 | 0.7266 | 0.7000 |
Fair Value Gaps / Imbalances
| Gap Number | High | Low |
| Bullish FVG Zone 1 | 0.7559 | 0.7266 |