The current price of SEI USDT is $0.7227 based on the 4 hour timeframe analysis. In this article, we will analyze the key support and resistance levels, Fibonacci retracement levels, supply zones, and fair value gaps/imbalances that may provide insight on where the price of SEI is likely to go next.
4 Hour Timeframe
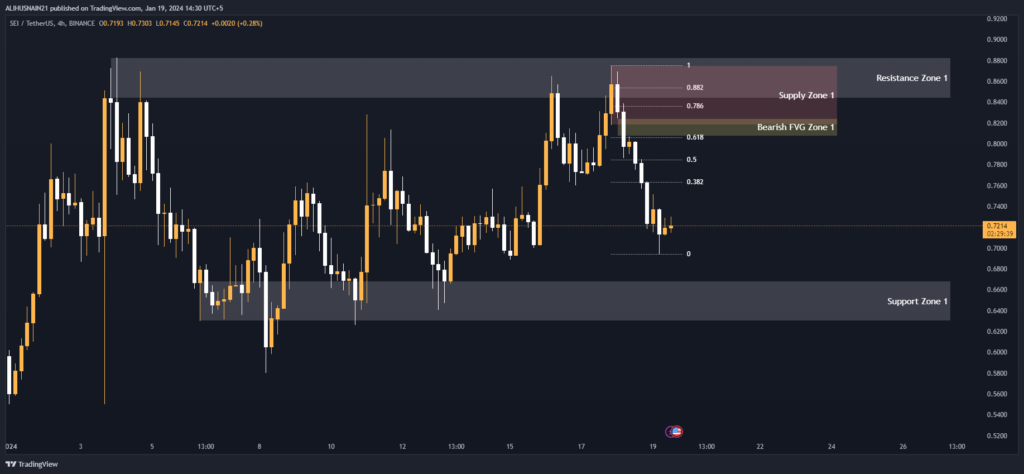
Support and Resistance Levels
Looking at the support and resistance zones on the 4 hour chart, we can see that SEI currently finds itself between the support zone of $0.6684-$0.6300 and resistance zone of $0.8828-$0.8436. If the price can break above the resistance zone, this would be a bullish sign and could lead to further upside toward the next resistance levels. Conversely, a break below the strong support zone would imply more downside is likely in the short term.
Fibonacci Retracement Levels
The four hour chart also shows us the key Fibonacci retracement levels that may act as upside targets or areas of resistance if reached. The closest level is the 0.382 Fib at $0.7632. Above this, resistance could be found at the 0.50, 0.618, 0.786 and 0.882 Fib levels between $0.7848-0.8538. A break above the 0.882 level would indicate the long term uptrend is intact.
Supply Zones
Looking at areas where sell pressure may come into play, we can see a minor supply zone between $0.8751-0.8181. If price rises into this zone, bears may look to defend this area and push price back lower. A break above the supply zone would negate its short term bearish influence.
Fair Value Gaps/Imbalances
The four hour chart also shows us a bearish fair value gap (FVG) between $0.8244-0.8074. This gap leaves an “island” that buyers still need to fill to confirm an uptrend. As long as price remains below this gap, downside pressure will remain for lower lows to be made.
Support and Resistance Levels
| S / R Type | High | Low |
| Support Zone 1 | 0.6684 | 0.6300 |
| Resistance Zone 1 | 0.8828 | 0.8436 |
Fibonacci Retracement Levels
| 0.382 | 0.7632 |
| 0.50 | 0.7848 |
| 0.618 | 0.8057 |
| 0.786 | 0.8364 |
| 0.882 | 0.8538 |
Supply Zone
| Zone Number | High | Low |
| Supply Zone 1 | 0.8751 | 0.8181 |
Fair Value Gaps / Imbalances
| Gap Number | High | Low |
| Bearish FVG Zone 1 | 0.8244 | 0.8074 |
1 Hour Timeframe
On the 1 hour chart, we can analyze shorter term signals and levels in more depth:
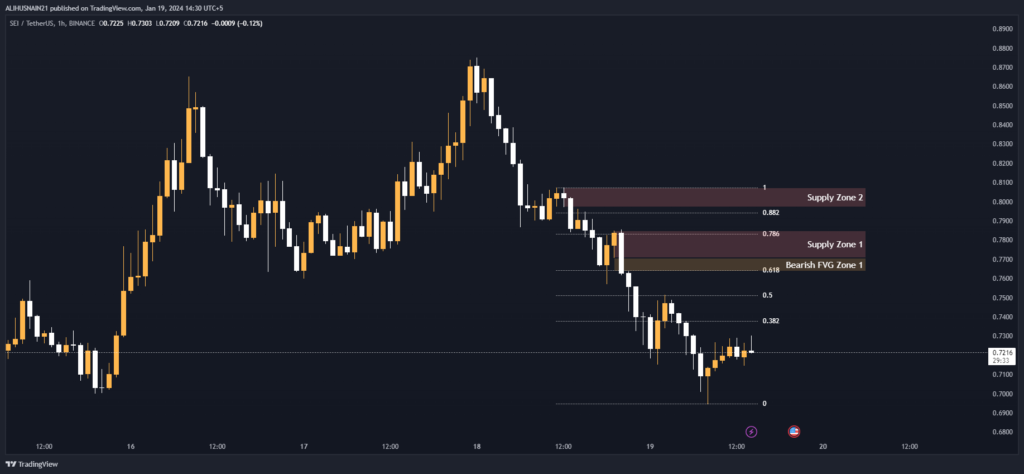
Fibonacci Retracement Levels
The 0.382, 0.50, 0.618, 0.786 and 0.882 Fibonacci retracement levels are plotted from $0.7380-0.7942. The closest support is at the 0.382 level of $0.7380. Holding this level would keep the short term trend bullish.
Supply Zones
There is minor supply expected between $0.7849-0.7706 in the first supply zone. Above this, stronger supply likely lies between $0.8073-0.7970 in the second supply zone. Breaks above each zone would add confidence to the upside.
Fair Value Gaps/Imbalances
A bearish FVG also exists on this timeframe between $0.7706-0.7638. Closing below this gap could ignite further downside momentum in the next 1-4 hours.
Fibonacci Retracement Levels
| 0.382 | 0.7380 |
| 0.50 | 0.7510 |
| 0.618 | 0.7643 |
| 0.786 | 0.7832 |
| 0.882 | 0.7942 |
Supply Zone
| Zone Number | High | Low |
| Supply Zone 1 | 0.7849 | 0.7706 |
| Supply Zone 2 | 0.8073 | 0.7970 |
Fair Value Gaps / Imbalances
| Gap Number | High | Low |
| Bearish FVG Zone 1 | 0.7706 | 0.7638 |
In summary, the key things to watch for SEI are breaks above/below the 4HR support/resistance zones. Holding the 1HR 0.382 Fib level of $0.7380 keeps uptrend short term intact. Breaks above the supply zones and filling of FVGs are needed for sustained upside. Meanwhile, closes below these technical levels imply bearish continuations in the short term. Overall, neutral to bearish biases exist until the highlighted resistance levels are surpassed.
I hope this technical analysis of the key factors was helpful in identifying some potential near term price targets and overall bias for SEI USDT based on the 4HR and 1HR charts.