On both 4H and 1H timeframes SEI USDT, $0.7742 (4H) and $0.6631 (1H) are the key support levels to pay attention to for potential bounce opportunities. Alternatively, breaks below $0.7569 (4H) and $0.6594 (1H) could push the price lower in the near term.
Traders are advised to follow a risk management approach and take profits near supply zone highs for potential re-entries on dips.
In this technical analysis, we will examine the key support and resistance levels, Fibonacci retracement levels, supply zones and fair value gaps/imbalances that could provide potential trading opportunities on SEI/USDT trading pair on both 4-hour and 1-hour timeframes.
4 Hour Timeframe
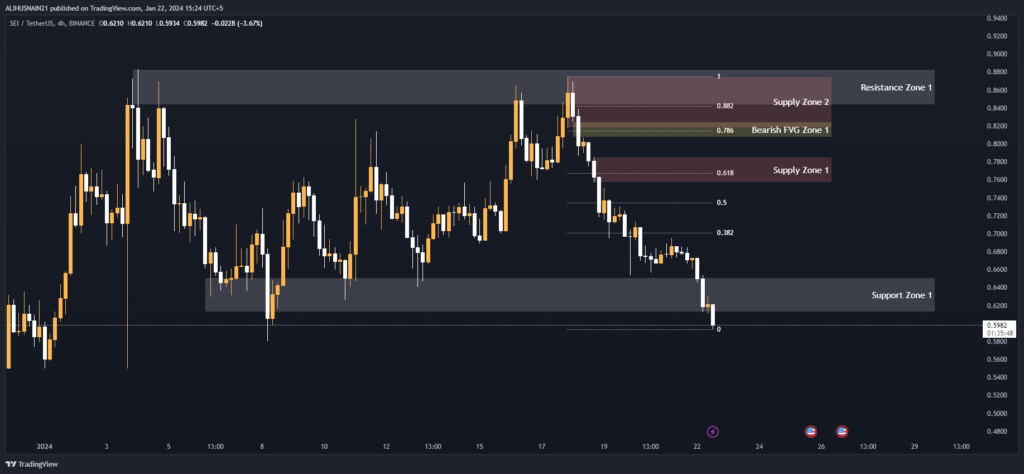
Support and Resistance Levels
As seen from the support and resistance table, there is a key support zone between $0.6126-$0.6510 that the price must hold to remain in an uptrend. Below this zone, the next support lies at $0.5871. On the upside, resistance zone 1 between $0.8436-$0.8828 is the level to watch. A break above this zone could see the price rally towards the next resistance of $1.
| S / R Type | High | Low |
| Support Zone 1 | 0.6510 | 0.6126 |
| Resistance Zone 1 | 0.8828 | 0.8436 |
Fibonacci Retracement Levels
Looking at the Fibonacci retracement levels drawn from the latest swing high of $0.8828 to the low of $0.6126, the 50% retracement level of $0.7430 and 61.8% level of $0.7742 are important support levels. A bounce from these levels could indicate continuation of the upside momentum. The 78.6% retracement level of $0.8185 acts as mid-term resistance.
| 0.382 | 0.7118 |
| 0.50 | 0.7430 |
| 0.618 | 0.7742 |
| 0.786 | 0.8185 |
| 0.882 | 0.8440 |
Supply Zone
The supply zones highlighted suggest that sell-offs could be expected in these zones due to existing stop-losses and sell orders. Supply zone 1 between $0.7569-$0.7855 and supply zone 2 between $0.8181-$0.8751 are the levels where downward pressure is likely to emerge.
| Zone Number | High | Low |
| Supply Zone 1 | 0.7855 | 0.7569 |
| Supply Zone 2 | 0.8751 | 0.8181 |
Fair Value Gaps / Imbalances
The bearish fair value gap zone 1 between $0.8074-$0.8244 implies that the price has an inclination to drop to fill this gap in the near future. This zone coincides with the supply zone 2, strengthening the bearish case for a short-term downside.
| Gap Number | High | Low |
| Bearish FVG Zone 1 | 0.8244 | 0.8074 |
Based on the above analysis, the key levels for a potential long setup on 4H includes a bounce from 61.8% Fibonacci level of $0.7742 or a close above supply zone 1 high of $0.7855. On the other hand, a close below $0.7569 or $0.8074 fair value gap could lead to a retest of support zone low.
1 Hour Timeframe
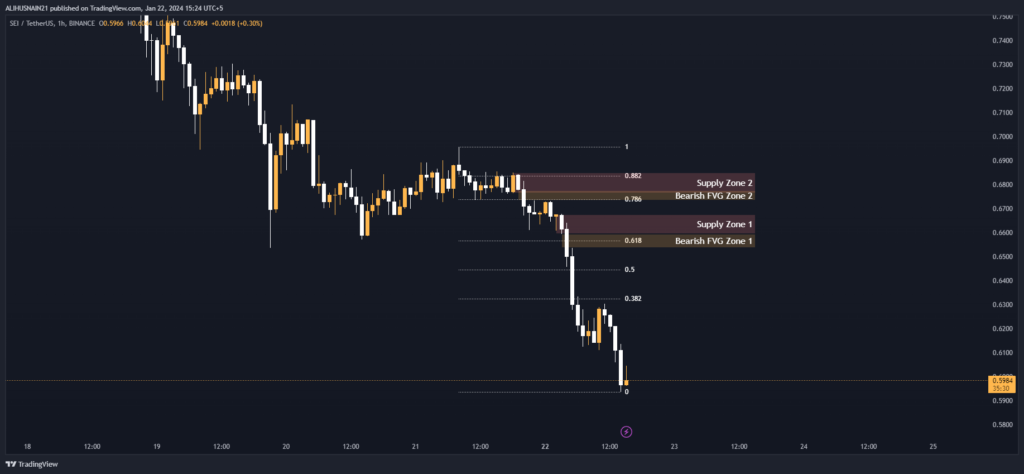
Potential intraday setups on 1H timeframe include looking to go long on a bounce from 38.2%, 50% or 61.8% Fib levels or a close above supply zone 1 high of $0.6674. On the flip side, closes below $0.6594 supply zone low or $0.6534 fair value gap low could see a retest of the next support levels.
Fibonacci Retracement Levels
The 1H Fibonacci retracement analysis echoes a similar support patterns as the 4H timeframe. The 38.2% level of $0.6432, 50% level of $0.6532 and 61.8% level of $0.6631 are strong intraday supports. A bounce from these levels can provide low-risk entry opportunities.
| 0.382 | 0.6432 |
| 0.50 | 0.6532 |
| 0.618 | 0.6631 |
| 0.786 | 0.6774 |
| 0.882 | 0.6856 |
Supply Zone
Supply zone 1 between $0.6594-$0.6674 and supply zone 2 between $0.6762-$0.6849 are the levels where downward momentum is expected due to existing sell-side liquidity.
| Zone Number | High | Low |
| Supply Zone 1 | 0.6674 | 0.6594 |
| Supply Zone 2 | 0.6849 | 0.6762 |
Fair Value Gaps / Imbalances
The bearish fair value gaps between $0.6534-$0.6594 and $0.6732-$0.6775 mirror the supply zones, indicating a high chance of price drop to fill these gaps.
| Gap Number | High | Low |
| Bearish FVG Zone 1 | 0.6594 | 0.6534 |
| Bearish FVG Zone 2 | 0.6775 | 0.6732 |