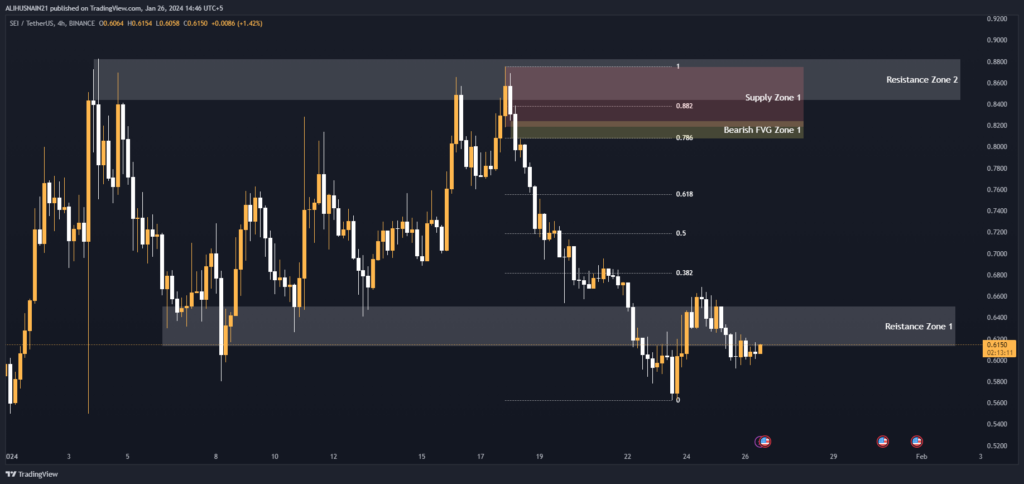
SEI USDT is currently moving within a consolidation range between $0.61-0.65 support and resistance levels in the 4H timeframe.
A break above $0.65, followed by a close above the supply zone at $0.6566-0.6421 could signal the start of an upward momentum targeting $0.68 and $0.71 levels over the next 1-2 weeks.
On the downside, immediate support is seen at the $0.61 level. Based on the current technical structure, the short term bias for SEI USDT remains neutral to bullish as long as it holds above $0.61.
4 Hour Timeframe
Support and Resistance Levels
As seen in the below table, SEI USDT is currently trading within a resistance zone between $0.6510-0.6126 based on the 4H timeframe.
Immediate resistance lies at $0.65 followed by a stronger resistance zone between $0.88-0.84. On the downside, support is seen at the $0.61 level. A break below this could see prices test the 0.382 Fib retracement level of $0.6819.
| S / R Type | High | Low |
| Resistance Zone 1 | 0.6510 | 0.6126 |
| Resistance Zone 2 | 0.8828 | 0.8436 |
Fibonacci Retracement Levels
The current price is finding support at the 0.382 Fib retracement level of $0.6819. Stronger supports are seen at 0.50 ($0.7185) and 0.618 ($0.7558) Fib levels.
These retracement levels will act as platforms for SEI USDT to bounce off in case of a temporary correction.
On the upside, resistance emerges at the 0.786 ($0.8085) and 0.882 ($0.8385) Fib levels.
| 0.382 | 0.6819 |
| 0.50 | 0.7185 |
| 0.618 | 0.7558 |
| 0.786 | 0.8085 |
| 0.882 | 0.8385 |
Supply Zone
As per the data, SEI USDT may face selling pressure in the supply zone between $0.8751-0.8181. A break above this zone will signal strong bullish momentum.
| Zone Number | High | Low |
| Supply Zone 1 | 0.8751 | 0.8181 |
Fair Value Gaps / Imbalances
The bearish fair value gap between $0.8244-0.8074 needs to be filled for SEI to continue its upward momentum. Until then, prices are expected to consolidate.
| Gap Number | High | Low |
| Bearish FVG Zone 1 | 0.8244 | 0.8074 |
1 Hour Timeframe
Fibonacci Retracement Levels
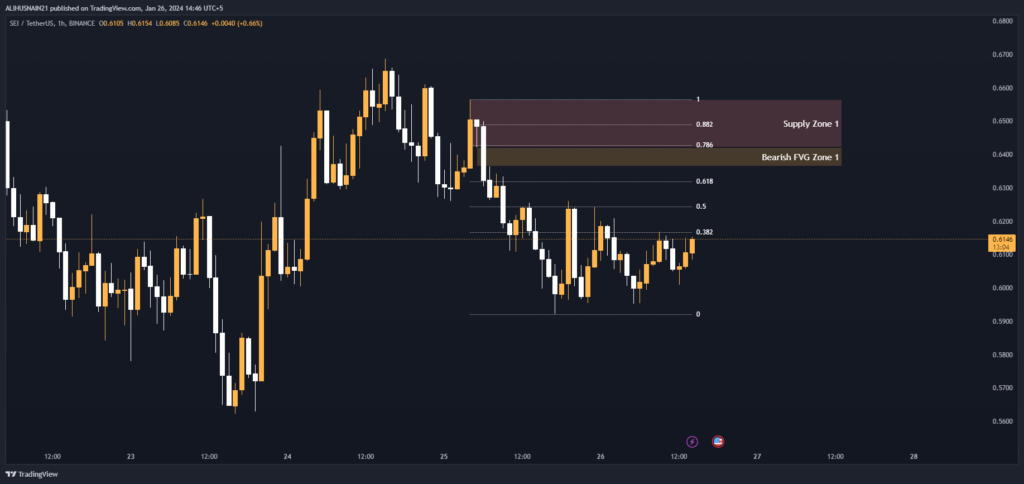
In the 1H chart, SEI USDT finds support at the 0.382 ($0.6168) and 0.50 ($0.6242) Fib levels. Immediate support is seen at $0.618 ($0.6319) retracement level.
On the upside, resistances are seen at the 0.786 ($0.6427) and 0.882 ($0.6489) levels.
| 0.382 | 0.6168 |
| 0.50 | 0.6242 |
| 0.618 | 0.6319 |
| 0.786 | 0.6427 |
| 0.882 | 0.6489 |
Supply Zone
Supply zone between $0.6566-0.6421 could pose a challenge for the bulls in the short term.
| Zone Number | High | Low |
| Supply Zone 1 | 0.6566 | 0.6421 |
Fair Value Gaps / Imbalances
The bearish fair value gap from $0.6421-0.6364 needs to be filled for SEI to resume its uptrend in the 1H chart.
| Gap Number | High | Low |
| Bearish FVG Zone 1 | 0.6421 | 0.6364 |