The current price of SEI USDT is 0.6404 based on the 4 hour timeframe chart. SEI USDT is in a short term bullish trend based on the support of demand zones and Fibonacci retracement levels on both 4 hourly and 1 hourly timeframe.
As long as it holds above the support zones of 0.6266 and 0.6169, the bullish trend is likely to continue towards the resistance of 0.8828. Intraday traders can utilize bounces from demand zones and fills of unfinished gaps. A break below 0.6115 will signal trend reversal.
Let us analyze the key support and resistance levels, Fibonacci retracement levels, demand zones and fair value gaps to determine the short to medium term price trends and potential reversal or continuation areas.
4 Hour Timeframe Analysis
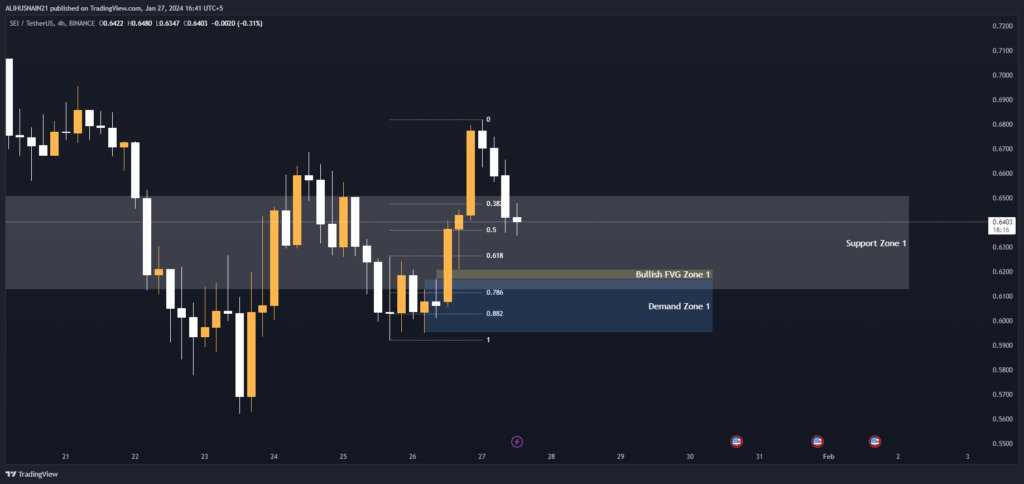
Based on the 4 hour timeframe analysis, as long as SEI USDT holds above the demand zone of 0.6169-0.5953 and the 0.382-0.618 Fibonacci retracement support zone, the short term trend will remain bullish with an aim to retest the resistance zone of 0.8828-0.8436.
However, a daily close below 0.6115 will signal a trend reversal to the downside.
Support and Resistance Levels
The strongest resistance level is the zone between 0.8828-0.8436. If price breaks above this zone, it will indicate a bullish continuation towards the next resistance of $1. A medium term support zone lies between 0.6510-0.6126. A break below this zone will signal a bearish price move.
| S / R Type | High | Low |
| Support Zone 1 | 0.6510 | 0.6126 |
| Resistance Zone 1 | 0.8828 | 0.8436 |
Fibonacci Retracement Levels
The 0.382, 0.50 and 0.618 Fibonacci retracement levels fall between 0.6477-0.6266. This area acts as strong support. If price bounces from this zone, it will indicate bullish pressure. A break below 0.6115 (0.786 retracement level) will turn the short term trend bearish.
| 0.382 | 0.6477 |
| 0.50 | 0.6371 |
| 0.618 | 0.6266 |
| 0.786 | 0.6115 |
| 0.882 | 0.6029 |
Demand Zone
There is a buy demand zone between 0.6169-0.5953. Aggressive buyers look to enter on a retest of this zone. A hold above this zone keeps the short term trend bullish.
| Zone Number | High | Low |
| Demand Zone 1 | 0.6169 | 0.5953 |
Fair Value Gaps / Imbalances
There is an unfinished bullish fair value gap between 0.6210-0.6169. Market participants will look to fill this gap which can induce volatile price movement.
| Gap Number | High | Low |
| Bullish FVG Zone 1 | 0.6210 | 0.6169 |
1 Hour Timeframe Analysis
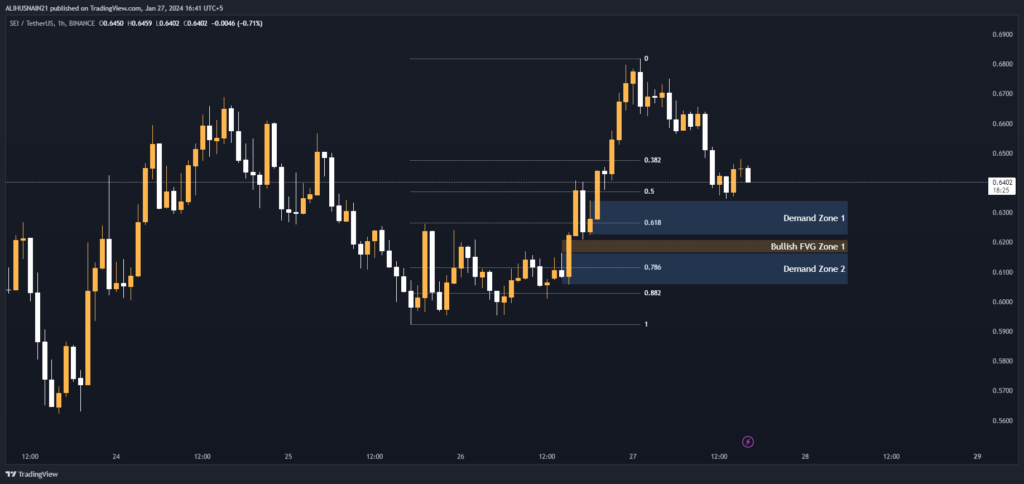
Based on the 1 hour analysis, SEI USDT needs to hold above the 0.618 Fibonacci support level of 0.6266 along with the demand zones in order to maintain its short term bullish trend. Intraday traders can look to enter on a retest of the fair value gap zone or on a bounce from either of the demand zones.
The key resistance area is between 0.6477-0.6371 (0.382-0.50 Fibonacci retracement levels). A break above this area will further strengthen the bullish momentum.
Fibonacci Retracement Levels
The key support levels remain the same as the 4 hour timeframe – 0.382 at 0.6477, 0.50 at 0.6371 and strong support at 0.618 level of 0.6266.
| 0.382 | 0.6477 |
| 0.50 | 0.6371 |
| 0.618 | 0.6266 |
| 0.786 | 0.6115 |
| 0.882 | 0.6029 |
Demand Zone
There are two demand zones that can induce a bounce – first between 0.6340-0.6224 and second between 0.6164-0.6057. Failure to hold above these zones will turn brief trend bearish.
| Zone Number | High | Low |
| Demand Zone 1 | 0.6340 | 0.6224 |
| Demand Zone 2 | 0.6164 | 0.6057 |
Fair Value Gaps / Imbalances
There is an unfinished bullish fair value gap between 0.6210-0.6164. Aggressive buyers will look for an entry on a retest of this zone.
| Gap Number | High | Low |
| Bullish FVG Zone 1 | 0.6210 | 0.6164 |