The current price of SEI USDT is trading at $0.7228 based on the 4-hour chart. Let’s analyze both the 4-hour and 1-hour timeframes to identify key support and resistance levels, Fibonacci retracement levels, demand zones, and fair value gaps that could provide clues about near-term price direction.
SEI USDT remains in an overall uptrend but consolidation is likely between the defined support and resistance levels. A hold above $0.6510 on the 4-hour timeframe or $0.6400 on the 1-hour would keep bulls in control of the near-term structure.
4 Hour Timeframe
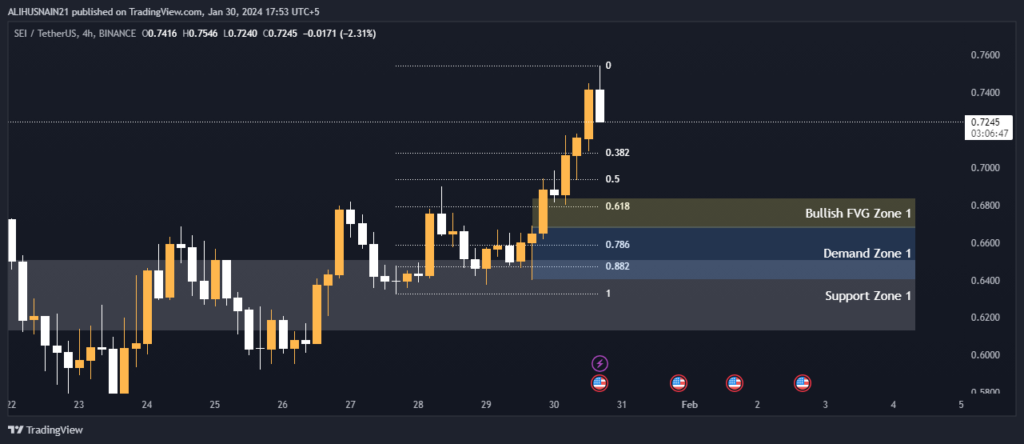
SEI USDT is currently trading above the major support zone between $0.6510-$0.6126. This zone encapsulates the recent lows and could provide a bounce if prices pullback. On the upside, the first resistance level sits at the 38.2% Fibonacci retracement of $0.6953.
Stronger resistance is found at the 50% retracement of $0.6835 and the 61.8% retracement of $0.6715.
There is an emerging demand zone between $0.6689-$0.6400 that saw multiple wicks absorbing selling pressure. A break above this zone would give bullish confirmation.
Additionally, the bullish fair value gap between $0.6802-$0.6689 could entice buyers on a retest, acting as support.
Support and Resistance Levels
| S / R Type | High | Low |
| Support Zone 1 | 0.6510 | 0.6126 |
Fibonacci Retracement Levels
| 0.382 | 0.6953 |
| 0.50 | 0.6835 |
| 0.618 | 0.6715 |
| 0.786 | 0.6545 |
| 0.882 | 0.6447 |
Demand Zone
| Zone Number | High | Low |
| Demand Zone 1 | 0.6689 | 0.6400 |
Fair Value Gaps / Imbalances
| Gap Number | High | Low |
| Bullish FVG Zone 1 | 0.6802 | 0.6689 |
1 Hour Timeframe
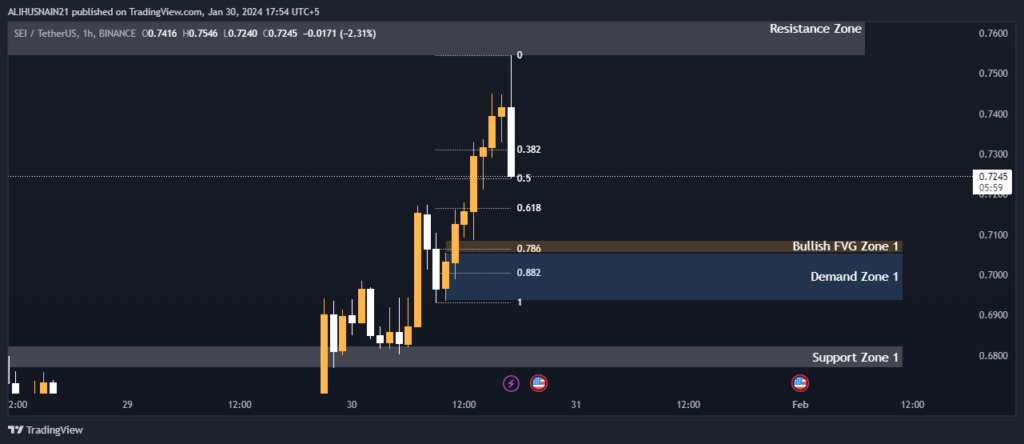
On the shorter 1-hour timeframe, support is seen between $0.6823-$0.6769 and $0.6454-$0.6400. A deeper pullback to the lower support zone could present a buying opportunity.
Resistance lies at the 38.2% Fibonacci retracement of $0.7185 and stronger levels at the 50% and 61.8% retracements of $0.7136 and $0.7088 respectively.
The demand zone between $0.7055-$0.6936 and bullish fair value gap from $0.7087-$0.7055 could halt any short-term declines. A push above this area would target a test of the major resistance trends seen on the 4-hour chart.
Support and Resistance Levels
| S / R Type | High | Low |
| Support Zone 1 | 0.6823 | 0.6769 |
| Support Zone 2 | 0.6454 | 0.6400 |
Fibonacci Retracement Levels
| 0.382 | 0.7185 |
| 0.50 | 0.7136 |
| 0.618 | 0.7088 |
| 0.786 | 0.7019 |
| 0.882 | 0.6980 |
Demand Zone
| Zone Number | High | Low |
| Demand Zone 1 | 0.7055 | 0.6936 |
Fair Value Gaps / Imbalances
| Gap Number | High | Low |
| Bullish FVG Zone 1 | 0.7087 | 0.7055 |