SOL USDT is currently trying to find acceptance above key resistance in the range of $96.49-$97.50 on the hourly scale after filling the bearish fair value gap. Meanwhile, intermediate support stands at $92.60-$94.33. Only a daily close above the 4HR resistance zone at $104.91-$106.79 would signal a shift in momentum to the upside in the medium term. Until then, the path of least resistance seems to be to the downside. Traders may consider waiting for a confirmed break above $97.50 on sustained hourly/4HR closures before taking fresh long positions.
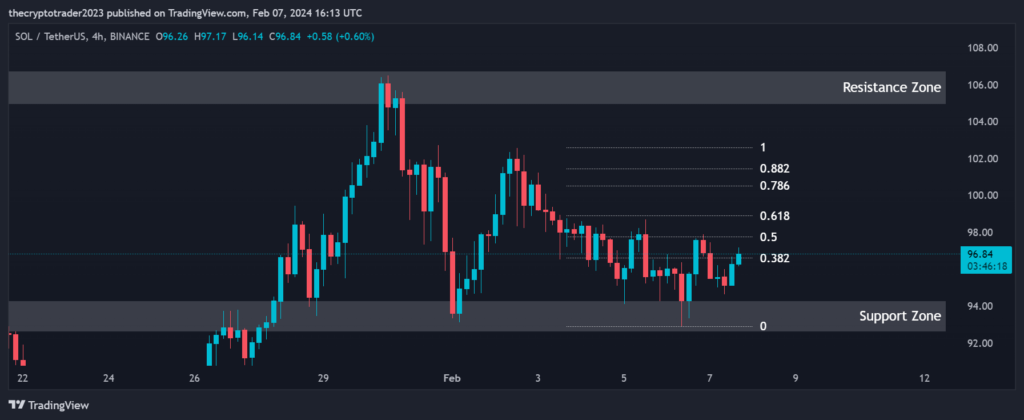
On the 4-hour chart, SOL USDT is finding support within the $92.60-$94.33 zone after recently bouncing from this area. Immediate resistance lies at $104.91-$106.79. The price is currently testing the 0.382 Fibonacci retracement level of $96.60 as resistance. A break above this level could see the price rise further to test the 0.50 level at $97.77 and 0.618 at $98.90. Alternatively, a fall below $94.33 support could see it drop towards lower levels. The 0.786 and 0.882 levels at $100.53 and $101.45 respectively will act as further upside resistance if tested.
Support and Resistance Levels
S / R Type
High
Low
Support Zone
92.60
94.33
Resistance Zone
104.91
106.79
Fibonacci Retracement Levels
0.382
96.60
0.50
97.77
0.618
98.90
0.786
100.53
0.882
101.45
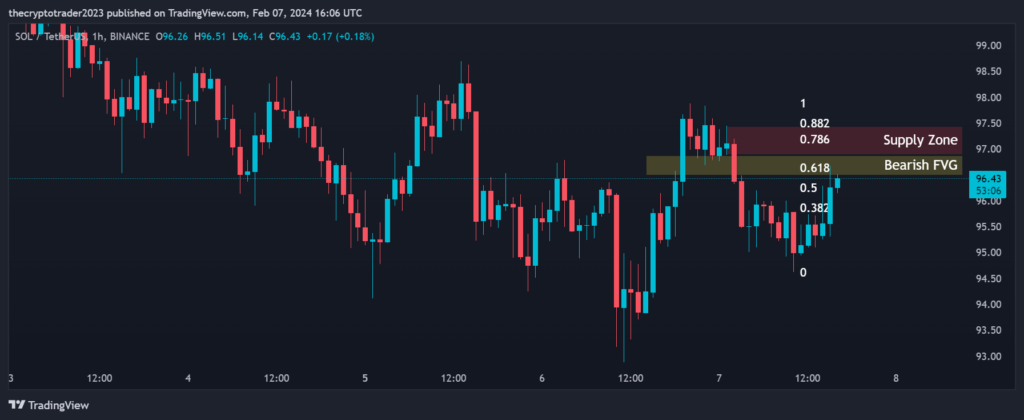
1 Hour Timeframe
Zooming into the 1-hour chart, we can see the price is contending with resistance at $96.49-$96.89 after filling the bearish fair value gap (BFVG) between these levels. The 0.382, 0.50, 0.618, 0.786 and 0.882 Fibonacci retracement levels stand at $95.87, $96.26, $96.65, $97.19 and $97.50 respectively, with the latter levels providing resistance going forward. Importantly, the supply zone from $96.89-$97.45 also overlaps with this resistance cluster. A break above $97.50 could see buyers gain more control in the near term. However, a failure to sustain above the aforesaid resistance levels may lead to another retest of the $94.33 support.