Key levels to watch for potential support/resistance breakouts that would signal the next leg in price are $97.28, $99.50, and $112.55 in the near future based on this 4 hour timeframe analysis of the SOL USDT pair.
For a more in-depth technical analysis across different timeframes, please click the link to view the identified levels of support and resistance, trends, and reversal patterns on the weekly, daily, and 1-hour charts.
4 Hour Timeframe
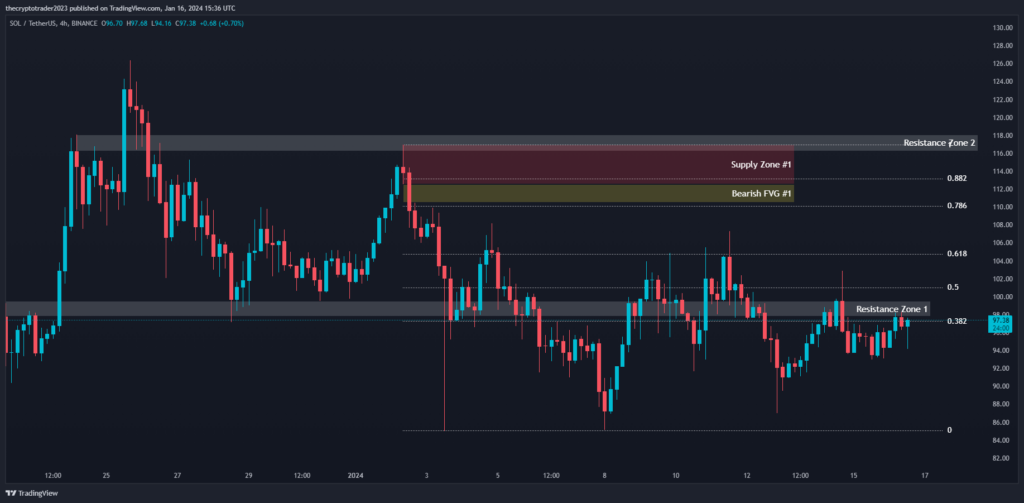
The current price of SOL USDT is $96.8. Looking at key Fibonacci retracement levels, the next support levels are at $97.28 (0.382 Fib), $101.09 (0.5 Fib), and $104.82 (0.618 Fib). A break below $97.28 could see further downward movement targeting the 0.5 and 0.618 Fib levels.
Above, there is a supply zone between $116.95-$112.55 that could act as resistance. If breached to the upside, this would be a bullish signal and prices could rise towards the next Fib resistance levels at $110.15, $113.19, and possibly retrace all the way back to the 0.886 Fib level at $113.19.
In the near term, prices are caught between the resistance zone of $99.50-$97.77 and support of the 0.382 Fib level at $97.28. A breakdown below $97.28 or rise above $99.50 would give clues on the next possible move.
There is also a bearish fair value gap between $112.55-$110.48. If prices were to drop back into this region it could accelerate downward momentum.
Fibonacci Retracement Levels
| 0.382 | 97.28 |
| 0.50 | 101.09 |
| 0.618 | 104.82 |
| 0.786 | 110.15 |
| 0.882 | 113.19 |
Supply Zone
| Zone Number | High | Low |
| Supply Zone #1 | 116.95 | 112.55 |
Suppor Resistance Zone
| S/R Type | High | Low |
| Resistance Zone #1 | 99.50 | 97.77 |
| Resistance Zone #2 | 118.10 | 116.22 |
Fair Value Gaps / Imbalances
| Gap Number | High | Low |
| Bearish FVG #1 | 112.55 | 110.48 |