The 4h and 1h timeframes paint a mixed picture for SOL USDT. Holding above short term support levels is important to avoid further losses in the near term. A break back above supply zones and resistance levels is needed to turn bullish once again. Traders should watch the mentioned support and resistance levels for entry and exit signals.
For a more in-depth technical analysis across different timeframes, please click the link to view the identified levels of support and resistance, trends, and reversal patterns on the weekly and daily charts of SOL USDT.
4 Hour Timeframe
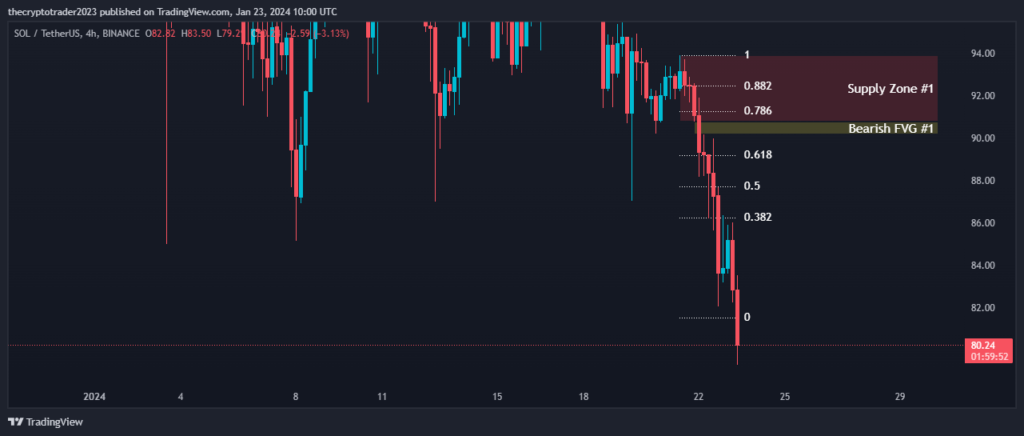
The 4h chart shows that Solana SOL USDT is currently trading below the important resistance levels of $99.50-97.77 and $118.10-116.22. This suggests the short term trend is bearish.
Fibonacci retracement levels show that SOL USDT recently fell from the 0.382 level of $86.27 and is currently finding support around the 0.50 level of $87.72. A breakdown below this level could see further losses towards the 0.618 level of $89.18.
There is a notable supply zone formed between $93.93-90.79. If SOL USDT rises back into this zone, it would face strong selling pressure which could push prices back lower.
A bearish fair value gap is visible between $90.79-90.17. This gap needs to be filled for the short term trend to turn bullish.
Support and Resistance Levels
| S / R Type | High | Low |
| Resistance Level #1 | 99.50 | 97.77 |
| Resistance Level #2 | 118.10 | 116.22 |
Fibonacci Retracement Levels
| 0.382 | 86.27 |
| 0.50 | 87.72 |
| 0.618 | 89.18 |
| 0.786 | 91.28 |
| 0.882 | 92.46 |
Supply Zone
| Zone Number | High | Low |
| 93.93 | 90.79 |
Fair Value Gaps / Imbalances
| Gap Number | High | Low |
| Bearish FVG #1 | 90.79 | 90.17 |
1 Hour Timeframe
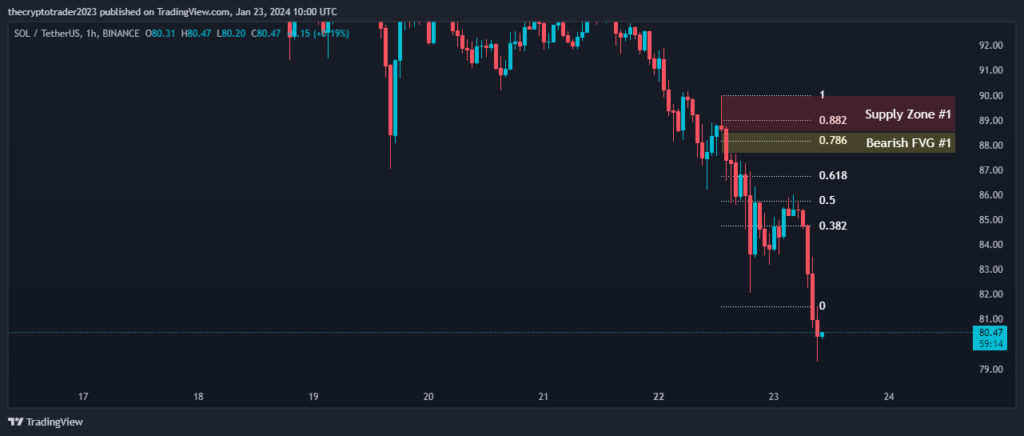
1 Hour Timeframe Analysis On the 1h chart, SOL USDT faces resistance in the $96.37-95.08 and $107.24-106.36 levels. It has fallen back from testing these levels.
The 0.382, 0.50 and 0.618 Fibonacci retracement levels line up closely between $84.74-86.76. HOLDING above this zone is important for the immediate bullish outlook.
Supply Zone #1 between $90-88.51 could stall any upside momentum. A breakdown below this zone, particularly a close below $88.51, increases the risk of the bearish FVG between $88.51-87.65 getting filled.
Support and Resistance Levels
| S / R Type | High | Low |
| Resistance Level #1 | 96.37 | 95.08 |
| Resistance Level #2 | 107.24 | 106.36 |
Fibonacci Retracement Levels
| 0.382 | 84.74 |
| 0.50 | 85.75 |
| 0.618 | 86.76 |
| 0.786 | 88.20 |
| 0.882 | 89.01 |
Supply Zone
| Zone Number | High | Low |
| Supply Zone #1 | 90.00 | 88.51 |
Fair Value Gaps / Imbalances
| Gap Number | High | Low |
| Bearish FVG #1 | 88.51 | 87.65 |