S&P 500 E-mini Futures (ES1!) is facing near term supply zone resistance on the 4 hour chart. A reversal could signal retest of daily demand zone and weekly support levels. Upside limited till supply zones are absorbed.
Weekly Timeframe

- Price is well supported between the 0.50 Fibonacci retracement level of 4482 and demand zone 1 from 4290.50-4122.25.
- Fair value gap zone 1 from 4354.25-4290.50 needs to be cleared.
Fibonacci Retracement Levels
| 0.382 | 4568.25 |
| 0.50 | 4482.00 |
| 0.618 | 4397.00 |
| 0.786 | 4276.25 |
| 0.882 | 4207.00 |
Demand Zone
| Zone Number | High | Low |
| Demand Zone 1 | 4290.50 | 4122.25 |
Fair Value Gaps / Imbalances
| Gap Number | High | Low |
| FVG Zone 1 | 4354.25 | 4290.50 |
Daily Timeframe
- Currently finding resistance between bullish 0.382 Fibonacci level of 4730.25 and bearish 0.382 level of 4755.50.
- Supply zone 1 is forming from 4841.50-4796.75 which aligns with bearish Fibonacci retracements.
- Support emerges between demand zone 1 of 4614.25-4548.75 and bullish Fibonacci levels.
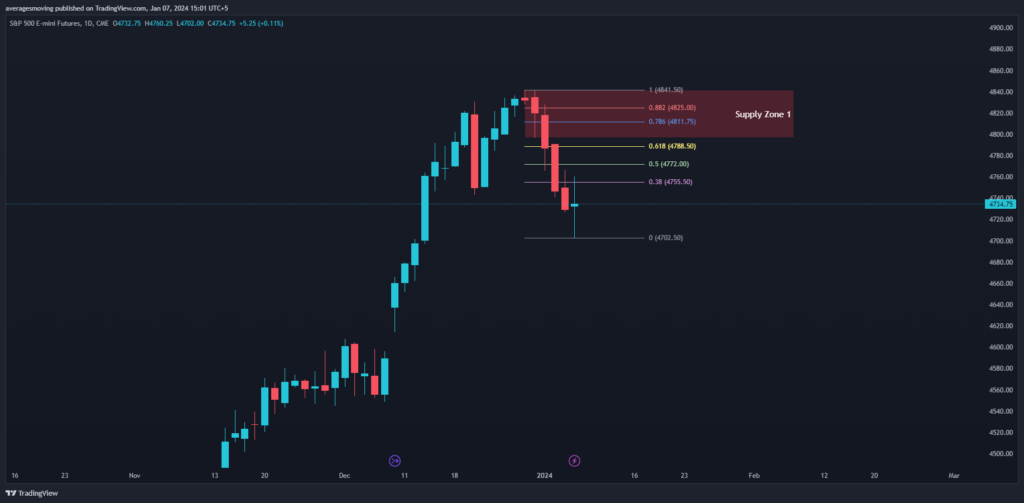
Fibonacci Retracement Levels (Bearish)
| 0.382 | 4755.50 |
| 0.50 | 4772.00 |
| 0.618 | 4788.50 |
| 0.786 | 4811.75 |
| 0.882 | 4825.00 |
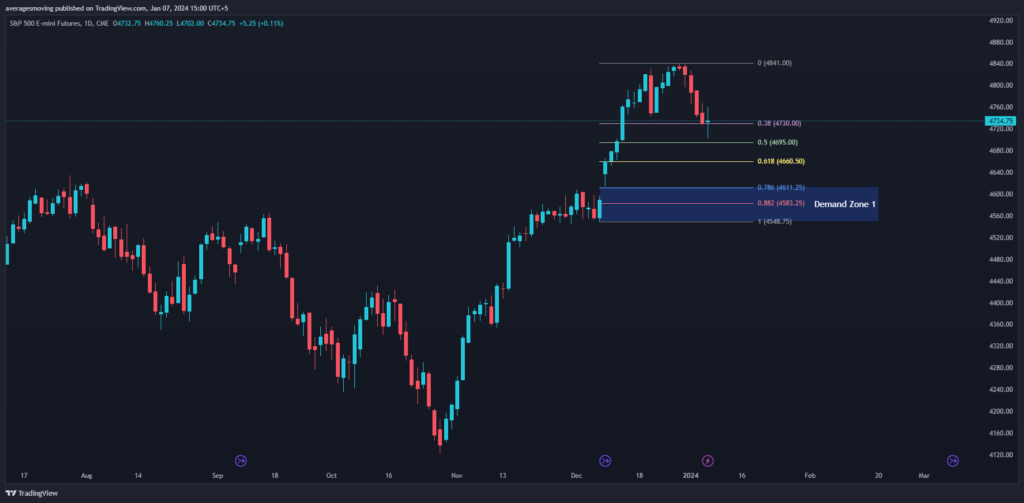
Fibonacci Retracement Levels (Bullish)
| 0.382 | 4730.25 |
| 0.50 | 4695.25 |
| 0.618 | 4660.50 |
| 0.786 | 4611.50 |
| 0.882 | 4583.25 |
Supply Zone
| Zone Number | High | Low |
| Supply Zone 1 | 4841.50 | 4796.75 |
Demand Zone
| Zone Number | High | Low |
| Demand Zone 1 | 4614.25 | 4548.75 |
4 Hour Timeframe
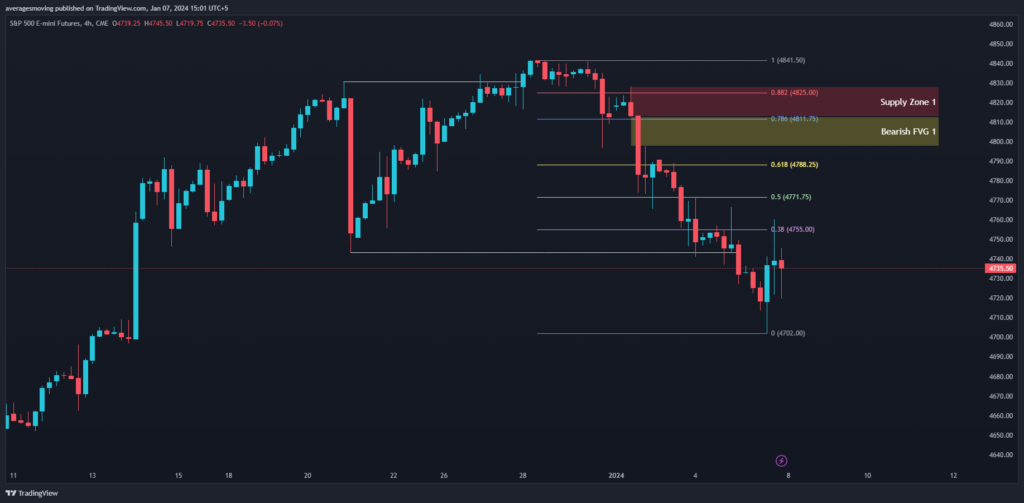
- Testing the supply zone 1 resistance of 4828-4812.75.
- Key resistance lies at 0.382 and 0.50 Fibonacci retracement levels of 4755 and 4771.75 respectively.
- Fair value gap from 4812.75-4797.50 adds to resistance.
- Supports are 0.618 Fibonacci level of 4788.25 and below.
Fibonacci Retracement Levels
| 0.382 | 4755.00 |
| 0.50 | 4771.75 |
| 0.618 | 4788.25 |
| 0.786 | 4811.75 |
| 0.882 | 4825.00 |
Supply Zone
| Zone Number | High | Low |
| Supply Zone 1 | 4828.00 | 4812.75 |
Fair Value Gaps / Imbalances
| Gap Number | High | Low |
| Bearish FVG 1 | 4812.75 | 4797.50 |