On the weekly timeframe SUI/USDT is finding support between key support zones. A weekly close above $1.0349 resistance is needed to trigger upside.
On lower timeframes, zones between $1.2069 – $1.2448 are providing near-term support as buyers defend demand clusters. Breakouts above $1.2751 resistance on the 1-hour chart could see a retest of highs unfold.
Weekly Timeframe
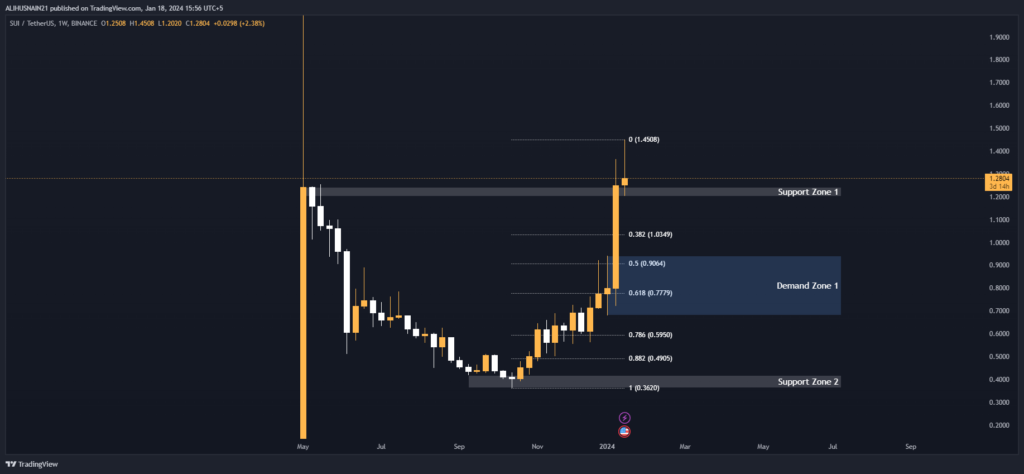
On the weekly timeframe, we can see that SUI/USDT is currently trading between two key support zones. Support Zone 1 runs from $1.2431 to $1.2016, while Support Zone 2 is found between $0.4185 to $0.3620.
These zones will be important for bullish momentum to hold. On the upside, resistance lies at the Fibonacci retracement levels of 0.382 at $1.0349 and 0.50 at $0.9064. A weekly close above these levels could signal the start of a new uptrend.
Support and Resistance Levels
| S / R Type | High | Low |
| Support Zone 1 | 1.2431 | 1.2016 |
| Support Zone 2 | 0.4185 | 0.3620 |
Fibonacci Retracement Levels
| 0.382 | 1.0349 |
| 0.50 | 0.9064 |
| 0.618 | 0.7779 |
| 0.786 | 0.5950 |
| 0.882 | 0.4905 |
Demand Zone
| Zone Number | High | Low |
| Demand Zone 1 | 0.9420 | 0.6800 |
Daily Timeframe
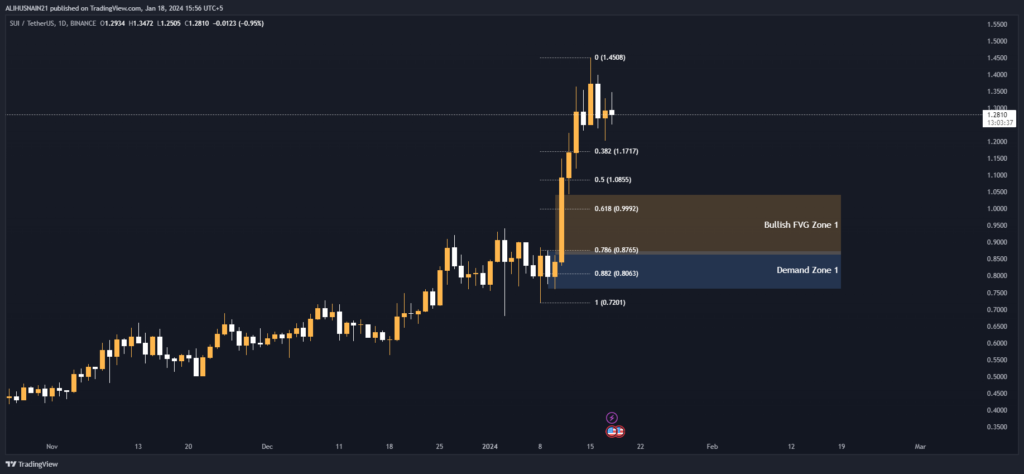
Zooming into the daily chart, we can see SUI/USDT is currently trading within Demand Zone 1 between $0.8743 to $0.7601. This zone is providing support and will be a key level for buyers to defend.
Above here, resistance lies at the 0.382 and 0.50 Fibonacci retracement levels of $1.1717 and $1.0855 respectively. A daily close above $1.0855 could imply further upside in the coming days. On the upside, Bullish Fair Value Gap Zone 1 between $1.0434 to $0.8622 could attract buying pressure if retested.
Fibonacci Retracement Levels
| 0.382 | 1.1717 |
| 0.50 | 1.0855 |
| 0.618 | 0.9992 |
| 0.786 | 0.8765 |
| 0.882 | 0.8063 |
Demand Zone
| Zone Number | High | Low |
| Demand Zone 1 | 0.8743 | 0.7601 |
Fair Value Gaps / Imbalances
| Gap Number | High | Low |
| Bullish FVG Zone 1 | 1.0434 | 0.8622 |
4 Hour Timeframe
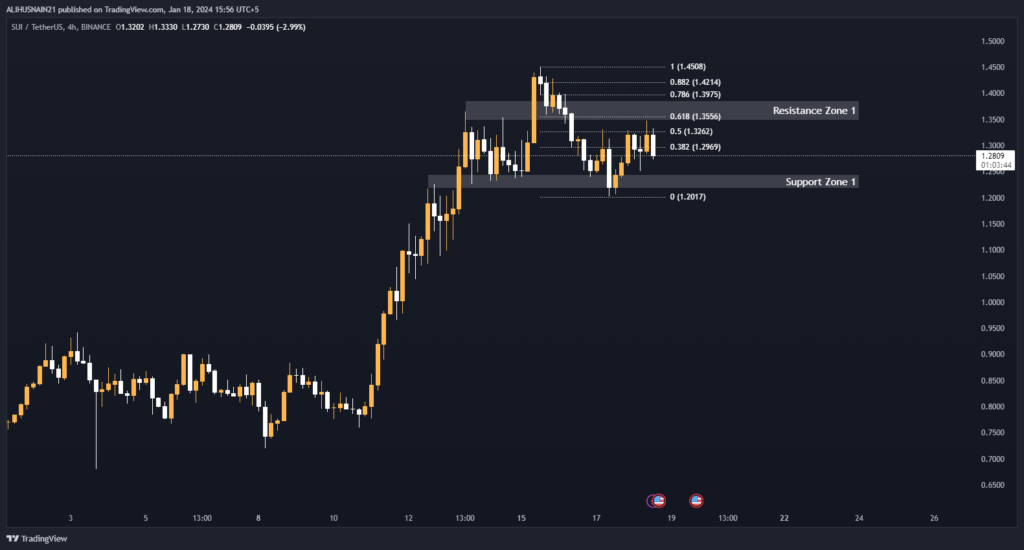
In the 4-hour timeframe, we can see SUI/USDT is finding support at Support Zone 1 between $1.2448 to $1.2177.
Holding above here keeps the near-term outlook neutral to bullish. On the upside, resistance is seen at Resistance Zone 1 from $1.3862 to $1.3472.
Breaking above this zone with volume could spark a move higher towards the 0.382 and 0.50 Fibonacci levels at $1.4214 and $1.3975 respectively.
Alternatively, a break below $1.2177 could shift momentum to the downside in the near-term. Demand Zone 1 between $1.2069 to $1.2262 could provide support if retested.
Support and Resistance Levels
| S / R Type | High | Low |
| Support Zone 1 | 1.2448 | 1.2177 |
| Resistance Zone 1 | 1.3862 | 1.3472 |
Fibonacci Retracement Levels
| 0.382 | 1.4214 |
| 0.50 | 1.3975 |
| 0.618 | 1.3556 |
| 0.786 | 1.3975 |
| 0.882 | 1.4214 |
1 Hour Timeframe
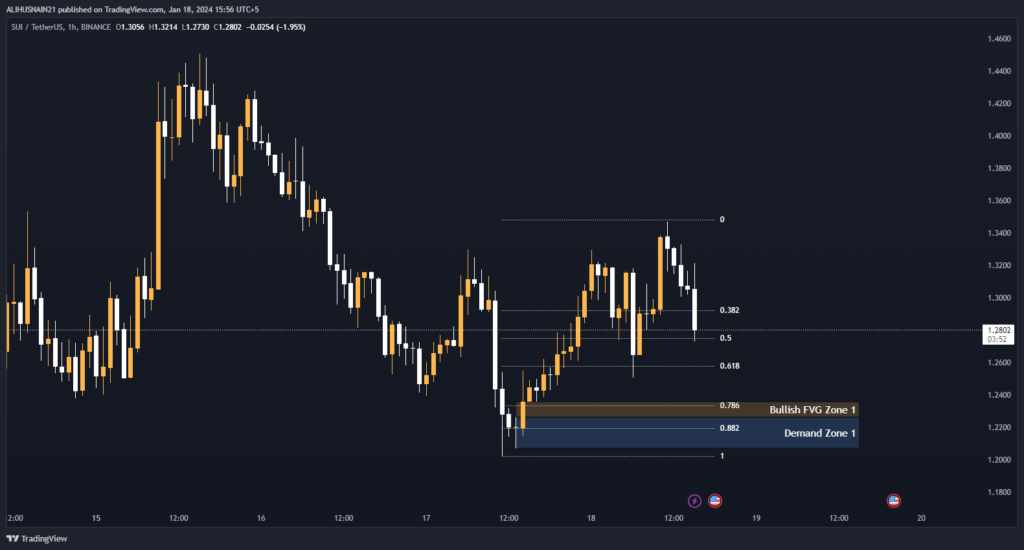
Looking at the 1-hour chart, we can see SUI/USDT is currently trading within Bullish Fair Value Gap Zone 1 between $1.2262 to $1.2358.
This zone is attracting buying interest and will look to hold as support. Above here, resistance lies at the 0.382, 0.50 and 0.618 Fibonacci retracement levels of $1.2923, $1.2751 and $1.2578 respectively.
A break above $1.2751 could open the door for a test of near-term highs. Alternatively, a break below $1.2262 shifts the bias back to neutral
Fibonacci Retracement Levels
| 0.382 | 1.2923 |
| 0.50 | 1.2751 |
| 0.618 | 1.2578 |
| 0.786 | 1.2333 |
| 0.882 | 1.2192 |
Demand Zone
| Zone Number | High | Low |
| Demand Zone 1 | 1.2069 | 1.2262 |
Fair Value Gaps / Imbalances
| Gap Number | High | Low |
| Bullish FVG Zone 1 | 1.2262 | 1.2358 |