Based on the technical analysis of the 4 hour and 1 hour chart of SUI USDT, the short to medium term outlook for Sui Network is neutral to bullish.
Upside potential exists on a break above key resistance at $1.2944 on the 4 hour and $1.2526 on the 1 hour.
Downside risk remains if support at $1.1944 is broken on larger timeframes. Overall, with support holding at current prices, the technical backdrop remains constructive for Sui Network.
4 Hour Timeframe
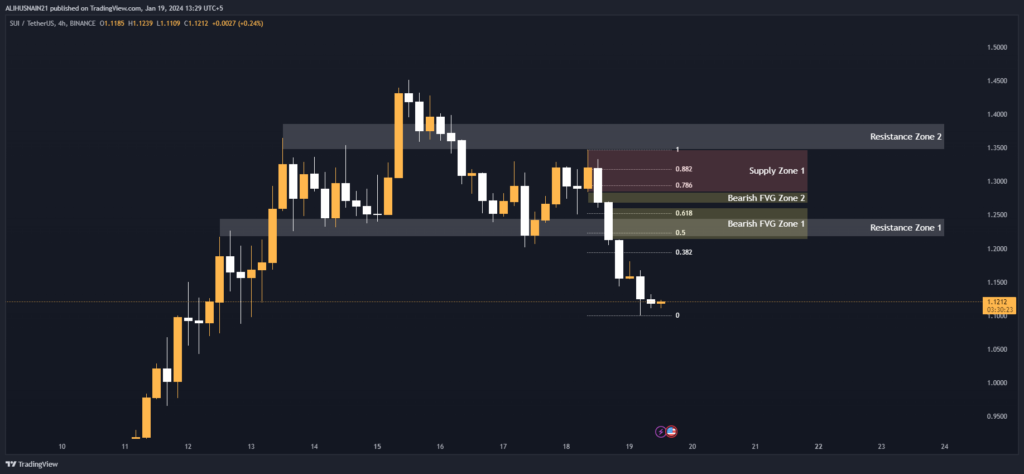
The current price of Sui Network on the 4 hour chart is $1.12. There are two key resistance zones between $1.2448-$1.2177 and $1.3862-$1.3472 that will need to be broken for the price to rise further.
The Fibonacci retracement levels show support levels at $1.1944 (0.382), $1.2238 (0.50), and $1.2526 (0.618) with resistance at $1.2944 (0.786) and $1.3180 (0.882). Holding above these support levels would be bullish.
There is a supply zone between $1.3472-$1.2844 that could create downward pressure if reached.
Two bearish fair value gaps (FVG) exist from $1.2609-$1.2131 and $1.2844-$1.2672. Closing these gaps would be a sign of upside momentum.
Overall, on the 4 hour chart the price is in a range between support at $1.1944 and resistance at $1.2944. A break above $1.2944 could ignite a rally towards resistance at $1.3472. However, holding support at current levels would maintain an outlook.
Support and Resistance Levels
| S / R Type | High | Low |
| Resistance Zone 1 | 1.2448 | 1.2177 |
| Resistance Zone 2 | 1.3862 | 1.3472 |
Fibonacci Retracement Levels
| 0.382 | 1.1944 |
| 0.50 | 1.2238 |
| 0.618 | 1.2526 |
| 0.786 | 1.2944 |
| 0.882 | 1.3180 |
Supply Zone
| Zone Number | High | Low |
| Supply Zone 1 | 1.3472 | 1.2844 |
Fair Value Gaps / Imbalances
| Gap Number | High | Low |
| Bearish FVG Zone 1 | 1.2609 | 1.2131 |
| Bearish FVG Zone 2 | 1.2844 | 1.2672 |
1 Hour Timeframe
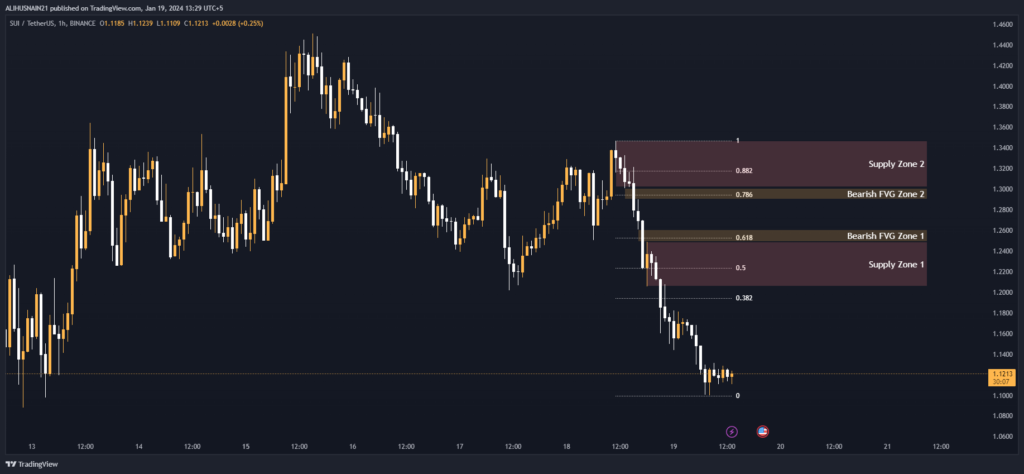
On the 1 hour chart, the Fibonacci retracement levels are consistent with the 4 hour chart. There are two supply zones between $1.2488-$1.2055 and $1.3472-$1.3018 that could lend selling pressure.
Two bearish FVGs exist from $1.2609-$1.2488 and $1.3007-$1.2902. Closing these gaps would signal shorter term positive momentum is building.
The shorter term outlook is neutral between support at $1.1944 and resistance at $1.2526. A break above $1.2526 could see a test of supply at $1.2488-$1.2055. However, holding current levels maintains an outlook.
Fibonacci Retracement Levels
| 0.382 | 1.1944 |
| 0.50 | 1.2232 |
| 0.618 | 1.2526 |
| 0.786 | 1.2944 |
| 0.882 | 1.3180 |
Supply Zone
| Zone Number | High | Low |
| Supply Zone 1 | 1.2488 | 1.2055 |
| Supply Zone 2 | 1.3472 | 1.3018 |
Fair Value Gaps / Imbalances
| Gap Number | High | Low |
| Bearish FVG Zone 1 | 1.2609 | 1.2488 |
| Bearish FVG Zone 2 | 1.3007 | 1.2902 |