SUI USDT is currently ranging between support at Demand Zone 1 and the Bearish FVG on the downside, while resistance up to Supply Zone 1 and Resistance Zone 1 needs to be overcome for bullish continuation.
Moving forward, traders should watch for potential breakouts or breakdown of these defined structures.
4 Hour Timeframe Analysis
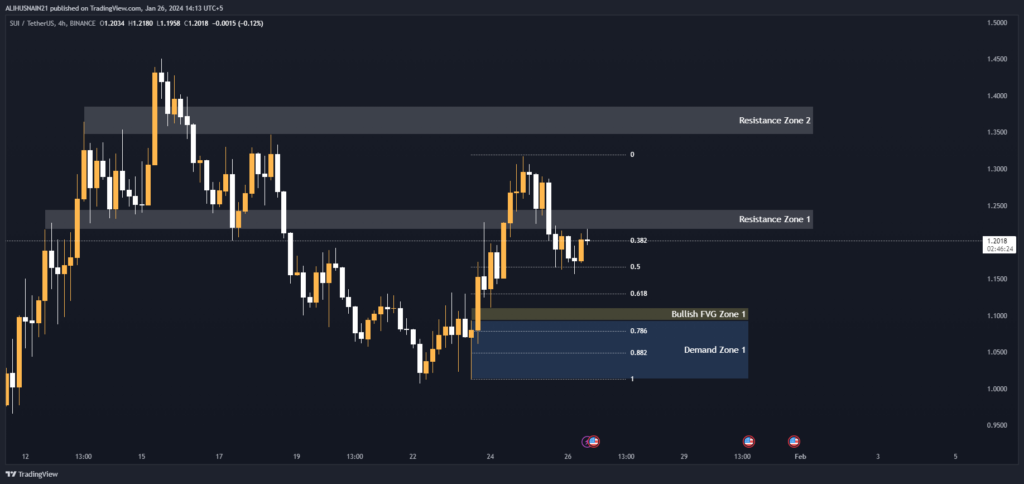
The 4 hour chart provides a good overview of the medium-term price trends and levels of support and resistance for SUI USDT. Let’s start by identifying some key levels:
Support and Resistance Levels
There are two clear resistance zones overhead that will need to be broken for the bulls to gain more upside momentum:
Resistance Zone 1 High: 1.2448 Low: 1.2177
Resistance Zone 2 High: 1.3862 Low: 1.3472
Breaking above Resistance Zone 1 could see prices test Resistance Zone 2 in the short-term. Conversely, support holds around current prices of SUI USDT.
| S / R Type | High | Low |
| Resistance Zone 1 | 1.2448 | 1.2177 |
| Resistance Zone 2 | 1.3862 | 1.3472 |
Fibonacci Retracement Levels
The Fibonacci retracement tool identifies potential reversal areas based on the recent price move. The levels to watch are:
Support 1 – 0.618 Fib Level at 1.1302
Support 2 – 0.786 Fib Level at 1.0788
A break below these supports would signal further downside is likely. Holding above keeps the uptrend intact.
| 0.382 | 1.2026 |
| 0.50 | 1.1659 |
| 0.618 | 1.1302 |
| 0.786 | 1.0788 |
| 0.882 | 1.0491 |
Demand Zone
This zone, where buyers have previously stepped in, could now act as an area of support:
Demand Zone 1 High: 1.0935 Low: 1.0130
If prices reach this zone, it may see an uptick in buyer activity as they look for lower entry points.
| Zone Number | High | Low |
| Demand Zone 1 | 1.0935 | 1.0130 |
Fair Value Gaps / Imbalances
This empty price level could now attract buying interest on a retest:
Bullish FVG Zone 1 High: 1.1108 Low: 1.0935
In summary, the 4H chart shows potential for further upside testing Resistance Zone 1 at 1.2448. However, indicators are bearishly diverging so pullbacks are possible too with support at Demand Zone 1 and Fib levels.
| Gap Number | High | Low |
| Bullish FVG Zone 1 | 1.1108 | 1.0935 |
1 Hour Timeframe Analysis
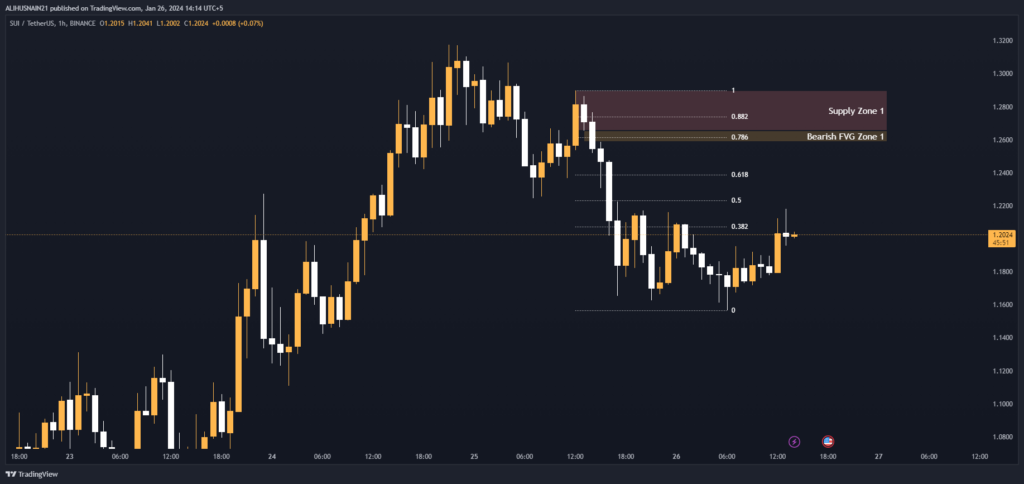
Drilling down to the 1H chart provides a closer look at the immediate term structure and levels:
Fibonacci Retracement Levels
The 0.618 and 0.786 Fib levels could act as resistance on any near term pullbacks:
Resistance 1 – 0.618 Fib at 1.2072 Resistance 2 – 0.786 Fib at 1.2611
| 0.382 | 1.2072 |
| 0.50 | 1.2232 |
| 0.618 | 1.2388 |
| 0.786 | 1.2611 |
| 0.882 | 1.2741 |
Supply Zone
This area may now attract selling pressure:
Supply Zone 1
High: 1.2898 Low: 1.2655
| Zone Number | High | Low |
| Supply Zone 1 | 1.2898 | 1.2655 |
Fair Value Gaps / Imbalances
Empty price level that may see renewed selling interest on a retest:
Bearish FVG Zone 1 High: 1.2655 Low: 1.2587
| Gap Number | High | Low |
| Bearish FVG Zone 1 | 1.2655 | 1.2587 |
Overall, the 1H chart shows indecision in the market between buyers and sellers around current prices. A break above Supply Zone 1 is needed to regain upside momentum, while a break below the 0.618 Fib level at 1.2072 signals a deeper pullback.