The current price of SUI USDT is trading at $1.3981 based on the given data. On the 4-hour chart, SUI USDT is finding support at the $1.3862 level after bouncing off this support zone once earlier.
Both the 4-hour and 1-hour timeframes are currently facing resistance. For the next move higher, SUI USDT would need to break above the $1.3253 fair value gap high and the 0.618 Fib level at $1.2865. Until then, downside towards the demand zone is possible. Break below the lower support zone at $1.2448 could signal a larger correction.
There is strong resistance currently found at the $1.456 level as price action has failed twice to break above this level in the past few days.
4 Hour Timeframe Analysis
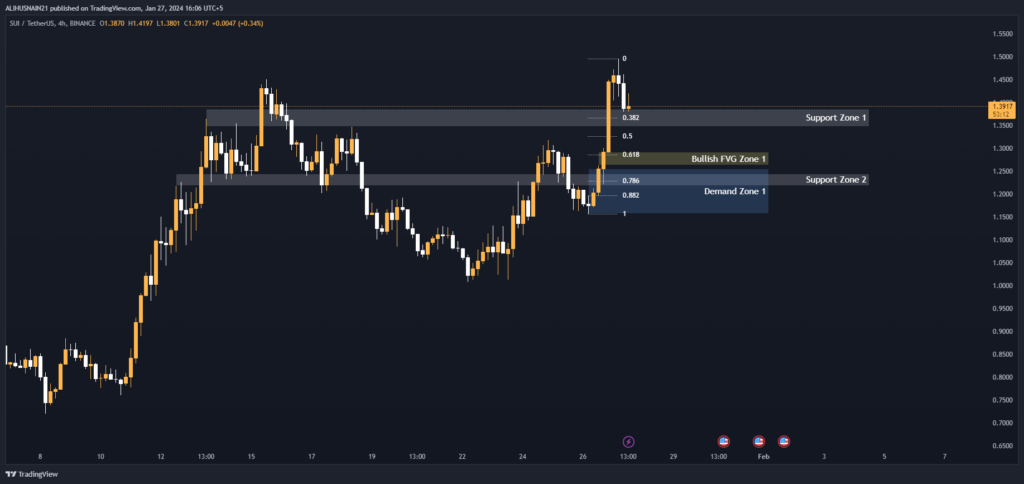
Support and Resistance Levels
On the 4-hour timeframe, we can identify two key support zones between $1.3472-$1.3862 and $1.2177-$1.2448. A breakdown below the lower support zone could indicate a larger downward move. There is also a demand zone between $1.1564-$1.2554 that could absorb selling pressure.
| S / R Type | High | Low |
| Support Zone 1 | 1.3862 | 1.3472 |
| Support Zone 2 | 1.2448 | 1.2177 |
Fibonacci Retracement Levels
The Fibonacci retracement levels provide upside targets to watch at the 0.382, 0.50, and 0.618 levels of $1.3662, $1.3264, and $1.2859 respectively. A break above $1.2859 FIB level would be a bullish sign.
| 0.382 | 1.3662 |
| 0.50 | 1.3264 |
| 0.618 | 1.2859 |
| 0.786 | 1.2292 |
| 0.882 | 1.1967 |
Demand Zone
| Zone Number | High | Low |
| Demand Zone 1 | 1.2554 | 1.1564 |
Fair Value Gaps / Imbalances
There is an outstanding bullish fair value gap between $1.2621-$1.2924 that may attract buyers on a fall and act as support.
| Gap Number | High | Low |
| Bullish FVG Zone 1 | 1.2924 | 1.2621 |
1 Hour Timeframe Analysis
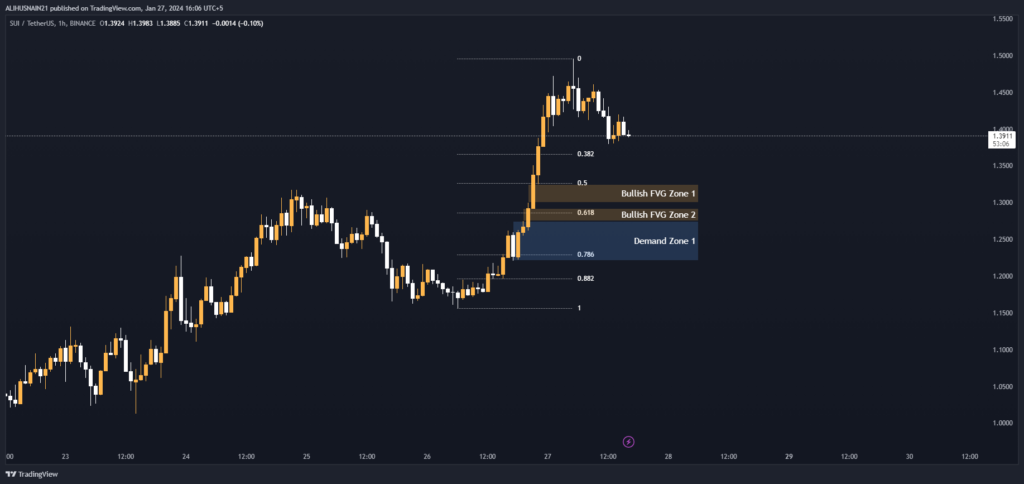
Fibonacci Retracement Levels
On the shorter 1-hour timeframe, Fibonacci retracement levels are currently acting as near term resistance at 0.382 ($1.3667), 0.50 ($1.3261) and 0.618 ($1.2865) levels. The 0.618 level will be a key resistance to watch.
| 0.382 | 1.3667 |
| 0.50 | 1.3261 |
| 0.618 | 1.2865 |
| 0.786 | 1.2294 |
| 0.882 | 1.1965 |
Demand Zone
There is a demand zone between $1.2210-$1.2748 that could absorb selling pressure in the short term.
| Zone Number | High | Low |
| Demand Zone 1 | 1.2748 | 1.2210 |
Fair Value Gaps / Imbalances
Two unfilled bullish fair value gaps also exist between $1.2748-$1.3000 and $1.2924-$1.3253. These gaps would need to be filled to resume the short term uptrend.
| Gap Number | High | Low |
| Bullish FVG Zone 1 | 1.3253 | 1.3000 |
| Bullish FVG Zone 2 | 1.2924 | 1.2748 |