In this analysis, I will examine the one hour chart of SUI USDT to identify key support and resistance levels, establish the overall market structure, and formulate potential trading scenarios going forward.
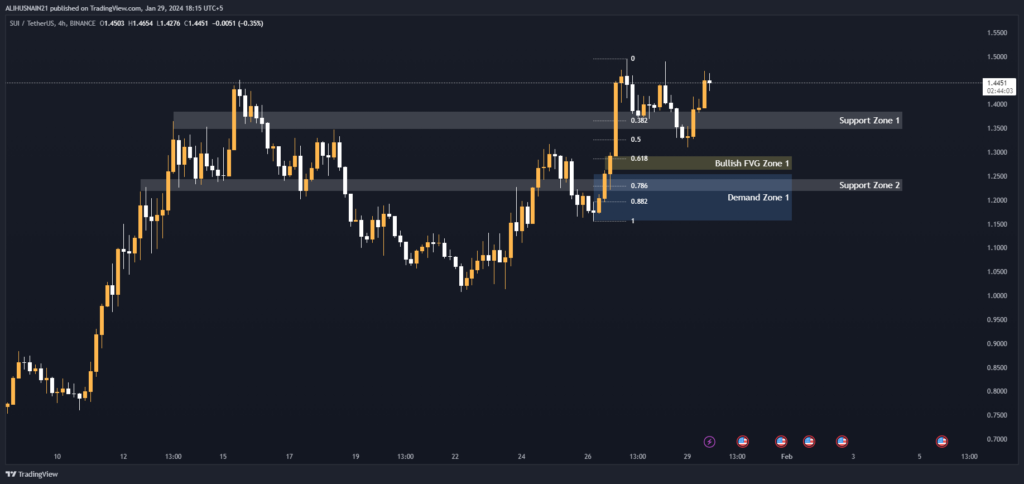
Traders can look for opportunities to enter long positions on bounces off the prominent demand zone between $1.3126-$1.3411 or breaks above nearby Fibonacci resistance levels like the 0.382. Meanwhile, further losses below $1.28 would likely expose the next support around $1.25.
On the topside, crossing above the bullish fair value gap/imbalance zone at $1.3827 could spark an acceleration higher, with the 0.50 and 0.618 Fibs the next upside targets. Overall volatility is likely to remain elevated given the prevailing bearish structure and macroeconomic uncertainty. Strict risk management will be crucial for any intraday positions.
Let’s begin by reviewing some background information and identifying important areas on the chart:
1 Hour Timeframe
Fibonacci Retracement Levels
Plotting the Fibonacci retracement between the Saturday 7th January high and current low outlines additional resistance and support thresholds. The key levels to watch on further upside momentum are the 0.382 at $1.4091, 0.50 at $1.3901, and 0.618 at $1.3713.
On the downside, loss of the 0.786 level would increase the risk of a retest of demand zone 1 or a continuation lower.
| 0.382 | 1.4091 |
| 0.50 | 1.3901 |
| 0.618 | 1.3713 |
| 0.786 | 1.3442 |
| 0.882 | 1.3291 |
Demand Zone
Within the current uptrend, we can identify one prominent demand zone between $1.3126-$1.3411 based on a cluster of higher time frame support levels. This zone lines up well with the 0.786 Fibonacci retracement level of $1.3442, adding confluence to its significance.
Whenever price approaches this zone in the future, it will be important to watch for signs of buying pressure and potentially an upside reversal.
| Zone Number | High | Low |
| Demand Zone 1 | 1.3411 | 1.3126 |
Fair Value Gaps / Imbalances
A notable bullish fair value gap/imbalance zone exists between $1.3382-$1.3827 based on a price gap left behind on the hourly chart during a strong rally in early January 2023.
This zone poses an area of potential upside resistance if revisited, but could also buoy price on a rebound from lower levels
| Gap Number | High | Low |
| Bullish FVG Zone 1 | 1.3827 | 1.3382 |
In closing, by assessing key reference levels including demand zones, Fibonacci retracements, and gaps/imbalances on SUI USDT’s hourly chart, traders can form a view of potential areas of support, resistance, and trading opportunities.
Continued monitoring of price action around these levels will provide clues about the near-term direction and help validate or invalidate bullish and bearish scenarios.