The current price of SUI USDT is 1.6086. Let’s analyze the short to medium-term technical picture on the 4-hour and 1-hour timeframes.
The technical indicators on the 4-hour and 1-hour timeframes suggest SUI USDT is in an overall upside bias above key support levels. Pullbacks are likely to find demand according to established zones.
Upside momentum could continue on a break above near-term Fibonacci resistance and the bullish FVG zone.
4 Hour Timeframe
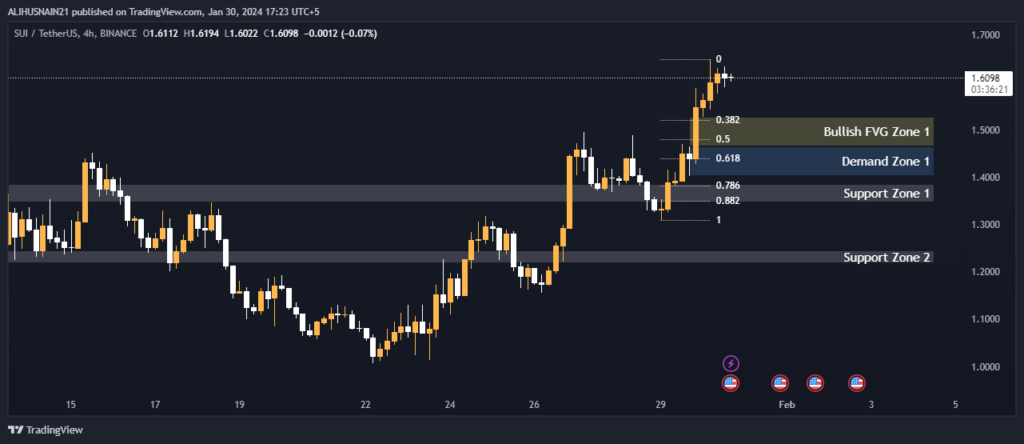
On the 4-hour chart, we can identify two key support zones between 1.3862-1.3472 and 1.2448-1.2177. Holding above these levels will be bullish for prices going forward.
Additionally, the Fibonacci retracement levels provide price objectives in the event of a pullback or correction. Notable levels are the 0.382 at 1.5198, 0.50 at 1.4801, and 0.618 at 1.4395.
The demand zone between 1.4654-1.4031 will be an area where buying interest is likely to emerge on any dips according to volume profile.
Breaking above could see prices target the bullish fair value gap (FVG) zone from 1.5274-1.4654.
Closing above the 0.786 Fib level at 1.3832 would strengthen the bull case.
On the downside, a break below the 1.2448-1.2177 support zone would signal the potential for a larger pullback or trend reversal. The 0.786 and 0.882 Fib levels may then come into play as resistance.
Support and Resistance Levels
| S / R Type | High | Low |
| Support Zone 1 | 1.3862 | 1.3472 |
| Support Zone 2 | 1.2448 | 1.2177 |
Fibonacci Retracement Levels
| 0.382 | 1.5198 |
| 0.50 | 1.4801 |
| 0.618 | 1.4395 |
| 0.786 | 1.3832 |
| 0.882 | 1.3499 |
Demand Zone
| Zone Number | High | Low |
| Demand Zone 1 | 1.4654 | 1.4031 |
Fair Value Gaps / Imbalances
| Gap Number | High | Low |
| Bullish FVG Zone 1 | 1.5274 | 1.4654 |
1 Hour Timeframe
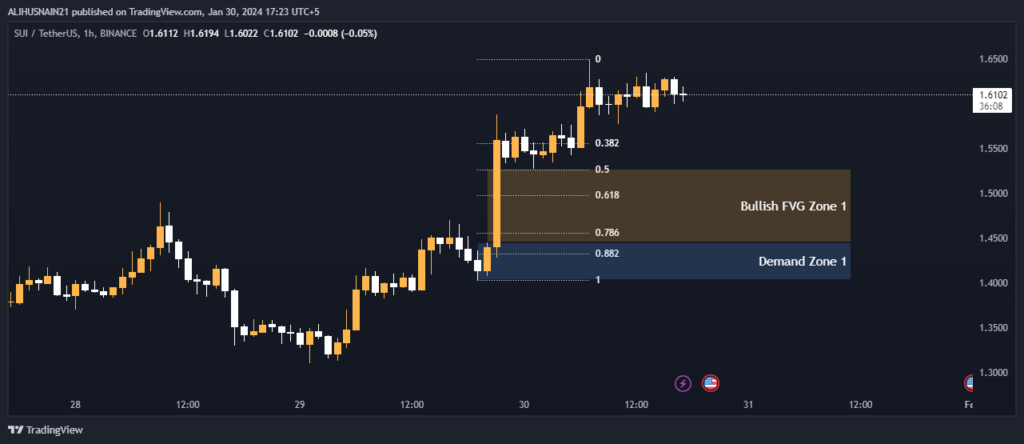
Drilling down to the 1-hour chart of SUI USDT, the Fibonacci retracement levels provide nearer term price objectives. The 0.382 at 1.5562, 0.50 at 1.5270, and 0.618 at 1.4978 would be targeted on an up move.
The 1.4446-1.4031 demand zone mirrors that seen on the higher time frame and will attract dip buying. Clearing the bullish FVG zone from 1.5274-1.4446 could see an extension of the current uptrend towards the next resistance levels.
On the 1-hour, bearish candles closing below 1.4031 would be the first sign of weakness. A breakdown below support at 1.3862-1.3472 could further accelerate declines from current levels.
Fibonacci Retracement Levels
| 0.382 | 1.5562 |
| 0.50 | 1.5270 |
| 0.618 | 1.4978 |
| 0.786 | 1.4562 |
| 0.882 | 1.4322 |
Demand Zone
| Zone Number | High | Low |
| Demand Zone 1 | 1.4446 | 1.4031 |
Fair Value Gaps / Imbalances
| Gap Number | High | Low |
| Bullish FVG Zone 1 | 1.5274 | 1.4446 |