On the 4-hour and 1-hour timeframes, support lies between $16.8135-$16.8700 with resistance currently found between $18.5234-$19.9000.
Key Fibonacci retracement and supply zone levels were also identified that can be used to gauge momentum and potential reversing points going forward.
The current price of TIA USDT $15.8934 finds support near the identified zones.
4 Hour Timeframe
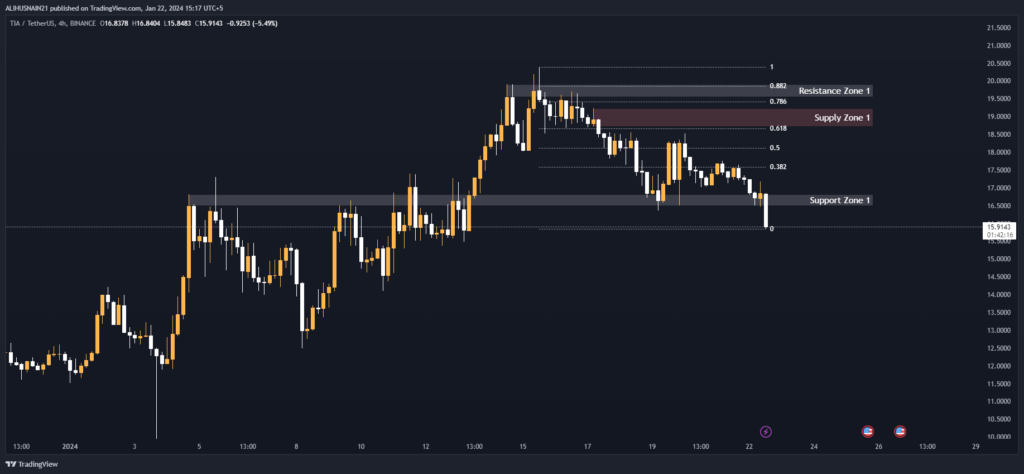
On the 4-hour timeframe, we can identify one key support zone between $16.8135-$16.4800. If price action moves lower, this will be the first area to watch as potential support. There is also one resistance zone between $19.9000-$19.5500 that may act as overhead resistance if prices move higher.
By applying Fibonacci retracement levels to the most recent swing high and low, we can see potential retracement levels at 0.382 ($17.9024), 0.50 ($18.3765), 0.618 ($18.8519), 0.786 ($19.5330) and 0.882 ($19.9185). These levels provide insight into potential price points where upside momentum may slow or reverse.
There is also one supply zone identified between $19.2246-18.7089. This zone represents an area of previous resistance that may now act as potential new resistance. If price action tests this zone, it will be important to watch for any potential seller response.
Support and Resistance Levels
| S / R Type | High | Low |
| Support Zone 1 | 16.8135 | 16.4800 |
| Resistance Zone 1 | 19.9000 | 19.5500 |
Fibonacci Retracement Levels
| 0.382 | 17.9024 |
| 0.50 | 18.3765 |
| 0.618 | 18.8519 |
| 0.786 | 19.5330 |
| 0.882 | 19.9185 |
Supply Zone
| Zone Number | High | Low |
| Supply Zone 1 | 19.2246 | 18.7089 |
1 Hour Timeframe
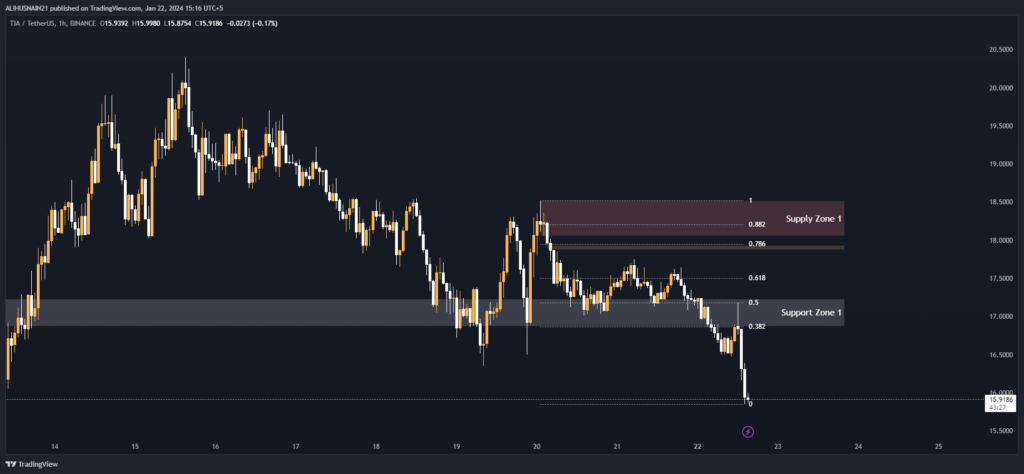
Zooming into the 1-hour chart, we see one key support zone is present between $17.2345-$16.8700. This level aligns with the support identified on the 4-hour chart and will be important to watch. There is also an overhead resistance zone between $18.5234-$18.0518 that may currently be capping upside momentum.
Fibonacci retracement levels on this timeframe are found at 0.382 ($17.2586), 0.50 ($17.4984), 0.618 ($17.7426), 0.786 ($18.0852) and 0.882 ($18.2823). These levels provide potential upside targets or reversing points.
A bearish fair value gap has also formed between $17.9328- $17.8733. This gap represents an imbalance that bulls will eventually look to fill, creating potential upside pressure. However, overhead resistance still persists and bears may look to defend the upper bounds of this zone.
Support and Resistance Levels
| S / R Type | High | Low |
| Support Zone 1 | 17.2345 | 16.8700 |
Fibonacci Retracement Levels
| 0.382 | 17.2586 |
| 0.50 | 17.4984 |
| 0.618 | 17.7426 |
| 0.786 | 18.0852 |
| 0.882 | 18.2823 |
Supply Zone
| Zone Number | High | Low |
| Supply Zone 1 | 18.5234 | 18.0518 |
Fair Value Gaps / Imbalances
| Gap Number | High | Low |
| Bearish FVG Zone 1 | 17.9328 | 17.8733 |