The current price action and technical indicators on the 4-hour and 1-hour timeframes point to a potentially bullish short-term outlook for TIA USDT above $15.60. Holding support at the plotted zones and breaking resistances with high volume could signal an emerging uptrend.
Traders may look to take long positions on a successful break above Resistance Zone 1 on the 4-hour at $16.48 or Resistance Zone 1 on the 1-hour at $16.87. The demand zone and fib retracement levels also provide potential areas of support on minor dips or pullbacks in the price of TIA USDT.
Overall, the analysis of TIA USDT points to upside potential if key levels hold, but a break below strong support could neutralize the bullish thesis.
4 Hour Timeframe
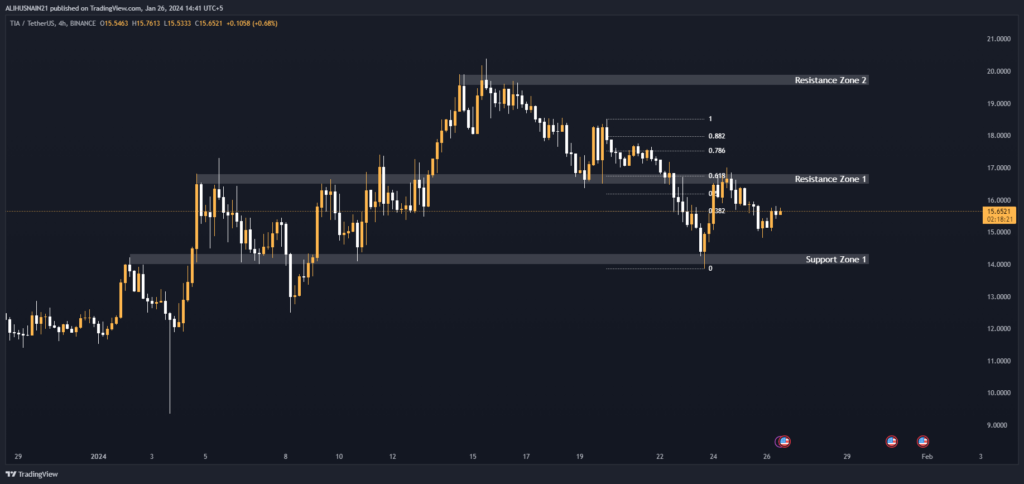
Support and Resistance Levels
As we can see from the table above, there are three key support and resistance zones to watch on the 4-hour timeframe for TIA USDT:
Support Zone 1: $14.3319 – $13.9907 If the price drops below this level, it indicates a potential downward trend. We want to see the price hold above this support.
Resistance Zone 1: $16.8135 – $16.4800
If the price breaks above this level, it could indicate an upward trend taking hold. A successful breakout above this resistance would be a bullish sign.
Resistance Zone 2: $19.9000 – $19.5500 A break above this resistance would confirm an established uptrend. Strong volume on the breakthrough would add more confirmation.
| S / R Type | High | Low |
| Support Zone 1 | 14.3319 | 13.9907 |
| Resistance Zone 1 | 16.8135 | 16.4800 |
| Resistance Zone 2 | 19.9000 | 19.5500 |
Fibonacci Retracement Levels
Looking at the Fibonacci retracement levels on the 4-hour chart of TIA USDT, we can see the 0.382, 0.50, and 0.618 levels that may act as support if the price starts retracing:
| Fibonacci Level | Price |
| 0.382 | $15.6493 |
| 0.50 | $16.1962 |
| 0.618 | $16.7431 |
Holding above these Fibonacci support levels would indicate the potential for the uptrend to continue. A break below would turn the outlook more bearish short-term.
| 0.382 | 15.6493 |
| 0.50 | 16.1962 |
| 0.618 | 16.7431 |
| 0.786 | 17.5266 |
| 0.882 | 17.9755 |
1 Hour Timeframe
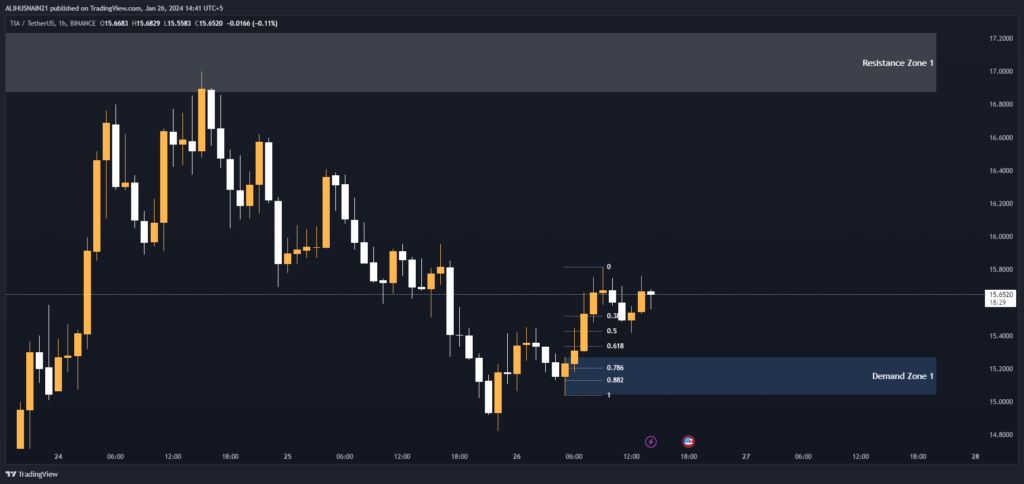
Support and Resistance Levels
On the 1-hour chart of TIA USDT, the key resistance zone to watch is:
Resistance Zone 1: $17.2345 – $16.8700 A successful break above this resistance could signal the start of an upward move on the smaller timeframe.
| S / R Type | High | Low |
| Resistance Zone 1 | 17.2345 | 16.8700 |
Fibonacci Retracement Levels
The 1-hour chart Fibonacci retracement levels that could provide support are:
| 0.382 | 15.5200 |
| 0.50 | 15.4271 |
| 0.618 | 15.3361 |
| 0.786 | 15.2054 |
| 0.882 | 15.1296 |
Demand Zone
There is also a demand zone that could kick in around:
Demand Zone 1: $15.2715 – $15.0385
This area has consolidated buying pressure on TIA USDT and could prop up the price on a minor pullback.
| Zone Number | High | Low |
| Demand Zone 1 | 15.2715 | 15.0385 |