Unless TIA USDT breaks above current resistance, further consolidation is on the cards over the next 1-4 hours. However, support from the demand clusters and FVG reduces downside risks in the near term. A conclusive break above 16.8700 could see an attempt at 17.2345 resistance.
4 Hour Timeframe Analysis
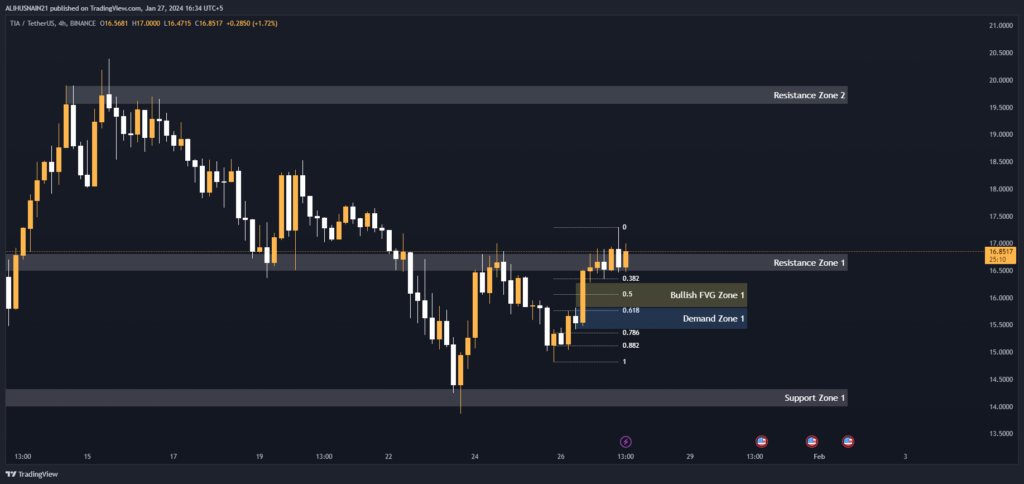
The 4 hour chart for TIA USDT shows that the price is currently trading within a broad Resistance Zone between 16.8135-16.4800. Above this zone sits the major Resistance Zone 2 ranging from 19.9000-19.5500. These zones indicate that upside momentum may be limited in the short term.
Looking at the Fibonacci retracement levels, we can see that the 0.618 level at 15.7668 closely lines up with the top of Demand Zone 1 between 15.8168-15.4195. This confluence of support factors increases the likelihood of a relief rally forming within this area if prices correct lower.
The chart also shows a potential Bullish Fair Value Gap/Imbalance forming between 16.2812-15.8168. These gaps/imbalances tend to attract buying pressure and act as magnets for prices over the medium term.
Overall, the 4 hour chart suggests that unless TIA USDT breaks clearly above Resistance Zone 1, further rangebound or sideways trading is likely between the demand cluster and resistance overhead in the coming sessions. A breakdown below 15.7668 could see a test of demand zone 1.
Support and Resistance Levels
| S / R Type | High | Low |
| Resistance Zone 1 | 16.8135 | 16.4800 |
| Resistance Zone 2 | 19.9000 | 19.5500 |
| Support Zone 1 | 14.3319 | 13.9907 |
Fibonacci Retracement Levels
| 0.382 | 16.3532 |
| 0.50 | 16.0600 |
| 0.618 | 15.7668 |
| 0.786 | 15.3564 |
| 0.882 | 15.1134 |
Demand Zone
| Zone Number | High | Low |
| Demand Zone 1 | 15.8168 | 15.4195 |
Fair Value Gaps / Imbalances
| Gap Number | High | Low |
| Bullish FVG Zone 1 | 16.2812 | 15.8168 |
1 Hour Timeframe Analysis
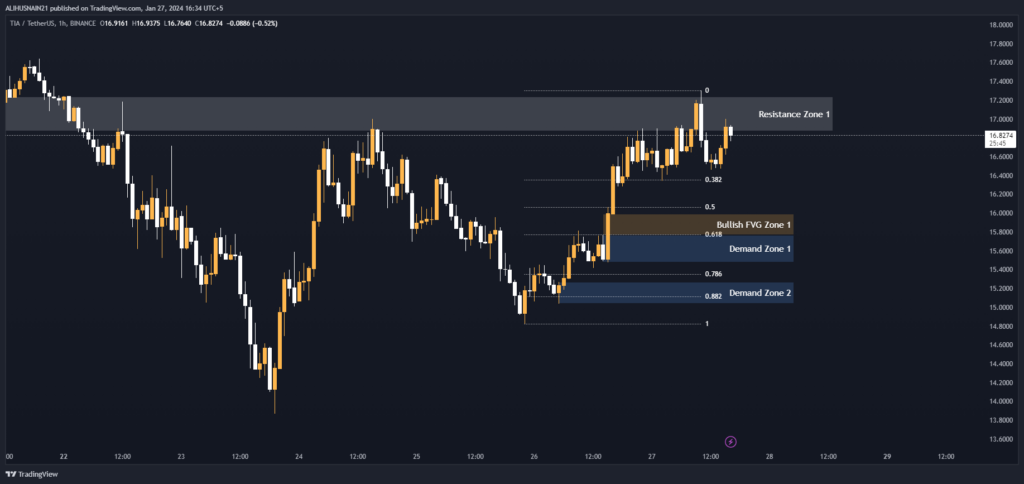
Zooming into the 1 hour chart of TIA USDT, we can gain more clarity on potential near term price action. The price is currently battling Resistance Zone 1 from 17.2345-16.8700. Below here sits support from the confluence of the 0.618 Fibonacci level and Demand Zone 1 between 15.7677-15.4753.
Additionally, Demand Zone 2 has formed between 15.2715-15.0385 slightly lower. This increases the support in case of a stronger downward move.
The 1 hour chart of TIA USDT also shows a fledgling Bullish FVG forming between 15.9928-15.7677. As with the 4 hour chart, this gap/imbalance could attract buyers on any intraday dips within its range.
Support and Resistance Levels
| S / R Type | High | Low |
| Resistance Zone 1 | 17.2345 | 16.8700 |
Fibonacci Retracement Levels
| 0.382 | 16.3532 |
| 0.50 | 16.0600 |
| 0.618 | 15.7668 |
| 0.786 | 15.3564 |
| 0.882 | 15.1134 |
Demand Zone
| Zone Number | High | Low |
| Demand Zone 1 | 15.7677 | 15.4753 |
| Demand Zone 2 | 15.2715 | 15.0385 |
Fair Value Gaps / Imbalances
| Gap Number | High | Low |
| Bullish FVG Zone 1 | 15.9928 | 15.7677 |